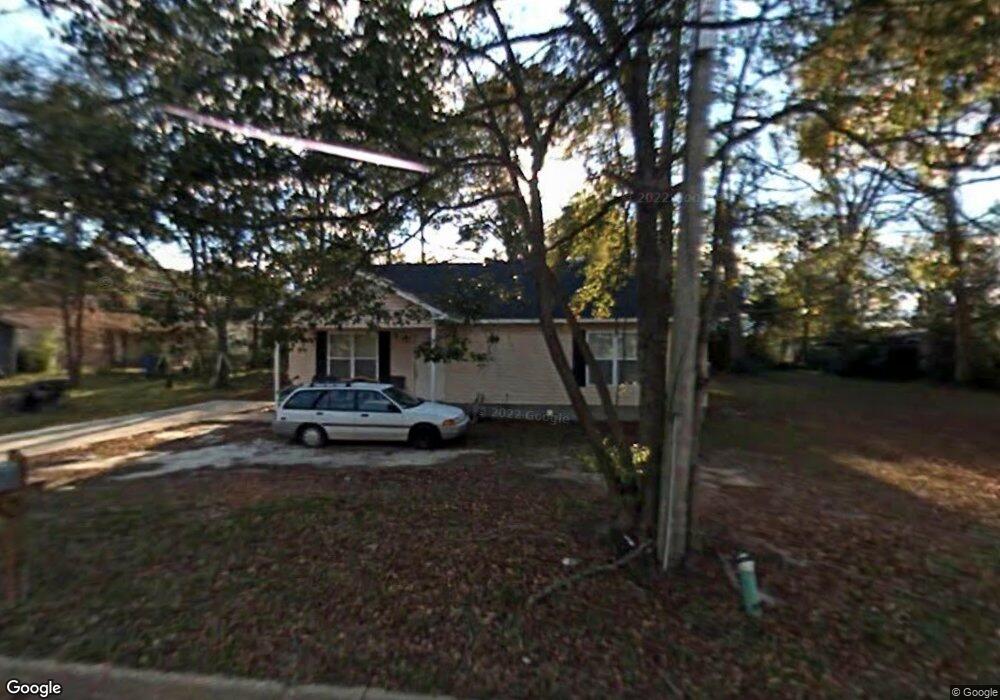
207 Short St Thomasville, GA 31792
Estimated Value: $130,000 - $184,000
--
Bed
2
Baths
966
Sq Ft
$161/Sq Ft
Est. Value
About This Home
This home is located at 207 Short St, Thomasville, GA 31792 and is currently estimated at $155,180, approximately $160 per square foot. 207 Short St is a home located in Thomas County with nearby schools including Thomasville High School, World of Truth Christian Academy, and Rescue Mission Christian School.
Ownership History
Date
Name
Owned For
Owner Type
Purchase Details
Closed on
Nov 2, 2007
Sold by
Smith Evelyn
Bought by
Smith Bridgett L
Current Estimated Value
Home Financials for this Owner
Home Financials are based on the most recent Mortgage that was taken out on this home.
Original Mortgage
$47,758
Outstanding Balance
$30,029
Interest Rate
6.26%
Mortgage Type
New Conventional
Estimated Equity
$125,151
Purchase Details
Closed on
Jul 13, 2006
Sold by
Dodson Steven T
Bought by
Smith Evelyn
Home Financials for this Owner
Home Financials are based on the most recent Mortgage that was taken out on this home.
Original Mortgage
$35,000
Interest Rate
6.6%
Mortgage Type
New Conventional
Purchase Details
Closed on
Feb 9, 2005
Sold by
Trutlin Bernice
Bought by
Dodson Steven T
Purchase Details
Closed on
Jan 9, 2004
Sold by
Trutlin Deloris
Bought by
Trutlin Bernice
Purchase Details
Closed on
Jan 8, 2004
Sold by
Trutlin Hayward and Trutlin
Bought by
Trutlin Bernice
Create a Home Valuation Report for This Property
The Home Valuation Report is an in-depth analysis detailing your home's value as well as a comparison with similar homes in the area
Home Values in the Area
Average Home Value in this Area
Purchase History
| Date | Buyer | Sale Price | Title Company |
|---|---|---|---|
| Smith Bridgett L | $47,758 | -- | |
| Smith Evelyn | $85,000 | -- | |
| Dodson Steven T | $4,500 | -- | |
| Trutlin Bernice | -- | -- | |
| Trutlin Bernice | -- | -- |
Source: Public Records
Mortgage History
| Date | Status | Borrower | Loan Amount |
|---|---|---|---|
| Open | Smith Bridgett L | $47,758 | |
| Previous Owner | Smith Evelyn | $35,000 |
Source: Public Records
Tax History Compared to Growth
Tax History
| Year | Tax Paid | Tax Assessment Tax Assessment Total Assessment is a certain percentage of the fair market value that is determined by local assessors to be the total taxable value of land and additions on the property. | Land | Improvement |
|---|---|---|---|---|
| 2024 | $1,264 | $52,996 | $4,379 | $48,617 |
| 2023 | $1,200 | $49,058 | $4,379 | $44,679 |
| 2022 | $376 | $41,852 | $3,808 | $38,044 |
| 2021 | $340 | $34,648 | $3,808 | $30,840 |
| 2020 | $330 | $33,015 | $3,808 | $29,207 |
| 2019 | $327 | $32,403 | $3,808 | $28,595 |
| 2018 | $319 | $31,415 | $3,808 | $27,607 |
| 2017 | $317 | $30,591 | $3,389 | $27,202 |
| 2016 | $306 | $29,555 | $3,389 | $26,166 |
| 2015 | $290 | $27,814 | $3,161 | $24,654 |
| 2014 | $286 | $27,221 | $3,161 | $24,060 |
| 2013 | -- | $27,221 | $3,160 | $24,060 |
Source: Public Records
Map
Nearby Homes
- 207 Mckinley St
- 515 Pine St
- 500 Wolf St
- 417 W West Walcott St
- 112 Horrix St
- 822 N Stevens St
- 313 Felix St
- 610 Gribben St
- 110 W Jackson St Unit PO-1
- 110 W Jackson St Unit P03
- 415 N Crawford St
- 201 Culpepper St
- 1101 N Crawford St
- 415 Fletcher St
- 526 N Crawford St
- 222 Victoria Place
- 925 W Jackson St
- 00 W Jackson St
- 447 Timber Ridge Drive (Lot 5a and 5b) Unit 5A5B
- 00 U S Highway 319 N Sanford Rd
- 211 Short St
- 606 W Clay St
- 201 Short St
- 608 W Clay St
- 604 W Clay St
- 806 N Martin Luther King jr Dr
- 208 Short St
- 810 N Martin Luther King jr Dr
- 210 Short St
- 610 W Clay St
- 614 W Clay St
- 218 Short St
- 00 Corner Clay Martin Luther King
- 601 W Clay St
- 214 Short St
- 616 W Clay St
- 544 W Clay St
- 601 W Calhoun St
- 611 W Clay St
- 1303 N Martin Luther King Junior Dr