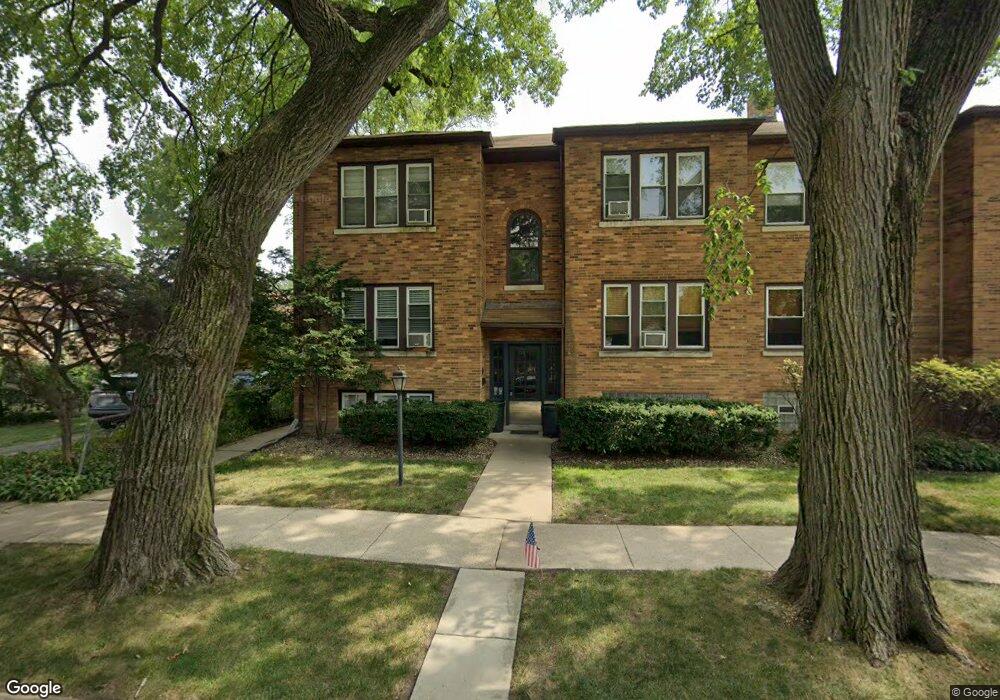
207 W Quincy St Unit 207-2 Riverside, IL 60546
Estimated Value: $168,000 - $195,704
2
Beds
1
Bath
16,532
Sq Ft
$11/Sq Ft
Est. Value
About This Home
This home is located at 207 W Quincy St Unit 207-2, Riverside, IL 60546 and is currently estimated at $181,426, approximately $10 per square foot. 207 W Quincy St Unit 207-2 is a home located in Cook County with nearby schools including Hollywood Elementary School, L J Hauser Jr High School, and Riverside Brookfield High School.
Ownership History
Date
Name
Owned For
Owner Type
Purchase Details
Closed on
Sep 30, 2019
Sold by
Kleyweg Donald
Bought by
Kaminski Gail
Current Estimated Value
Home Financials for this Owner
Home Financials are based on the most recent Mortgage that was taken out on this home.
Original Mortgage
$115,000
Outstanding Balance
$100,746
Interest Rate
3.5%
Mortgage Type
New Conventional
Estimated Equity
$80,680
Purchase Details
Closed on
Sep 23, 2004
Sold by
Czemik Michele L
Bought by
Kleyweg Donald
Home Financials for this Owner
Home Financials are based on the most recent Mortgage that was taken out on this home.
Original Mortgage
$100,000
Interest Rate
5.85%
Mortgage Type
Unknown
Purchase Details
Closed on
Apr 28, 2000
Sold by
Petrik Paul
Bought by
Czernik Michele L
Home Financials for this Owner
Home Financials are based on the most recent Mortgage that was taken out on this home.
Original Mortgage
$91,800
Interest Rate
8.24%
Create a Home Valuation Report for This Property
The Home Valuation Report is an in-depth analysis detailing your home's value as well as a comparison with similar homes in the area
Home Values in the Area
Average Home Value in this Area
Purchase History
| Date | Buyer | Sale Price | Title Company |
|---|---|---|---|
| Kaminski Gail | $140,000 | Chicago Title Insurance | |
| Kleyweg Donald | $153,000 | Chicago Title Insurance Comp | |
| Czernik Michele L | $102,000 | Chicago Title Insurance Co |
Source: Public Records
Mortgage History
| Date | Status | Borrower | Loan Amount |
|---|---|---|---|
| Open | Kaminski Gail | $115,000 | |
| Previous Owner | Kleyweg Donald | $100,000 | |
| Previous Owner | Czernik Michele L | $91,800 |
Source: Public Records
Tax History Compared to Growth
Tax History
| Year | Tax Paid | Tax Assessment Tax Assessment Total Assessment is a certain percentage of the fair market value that is determined by local assessors to be the total taxable value of land and additions on the property. | Land | Improvement |
|---|---|---|---|---|
| 2024 | $1,481 | $16,024 | $1,235 | $14,789 |
| 2023 | $1,568 | $16,024 | $1,235 | $14,789 |
| 2022 | $1,568 | $10,934 | $1,173 | $9,761 |
| 2021 | $2,799 | $10,934 | $1,173 | $9,761 |
| 2020 | $3,892 | $10,934 | $1,173 | $9,761 |
| 2019 | $2,831 | $11,473 | $1,080 | $10,393 |
| 2018 | $2,746 | $11,473 | $1,080 | $10,393 |
| 2017 | $2,677 | $11,473 | $1,080 | $10,393 |
| 2016 | $2,267 | $8,934 | $895 | $8,039 |
| 2015 | $2,172 | $8,934 | $895 | $8,039 |
| 2014 | $2,153 | $8,934 | $895 | $8,039 |
| 2013 | $4,667 | $14,959 | $895 | $14,064 |
Source: Public Records
Map
Nearby Homes
- 207 W Quincy St Unit GARD
- 3842 Woodside Ave
- 3827 Hollywood Ave
- 3811 Rosemear Ave
- 3525 Hollywood Ave
- 3645 Mccormick Ave
- 3845 Mccormick Ave
- 3600 Mccormick Ave
- 4010 Fern Ave
- 8636 40th St
- 78 Pine Ave
- 3434 Arden Ave
- 4054 Fern Ave
- 4053 Rose Ave
- 3913 Grove Ave
- 50 Forest Ave Unit 3S
- 4009 Forest Ave
- 8911 Burlington Ave
- 3948 Amelia Ave
- 8101 White Ave
- 207 W Quincy St Unit 207
- 213 W Quincy St Unit 213-2
- 213 W Quincy St Unit 213-1
- 209 W Quincy St Unit 209-2
- 207 W Quincy St Unit 207-1
- 209 W Quincy St Unit 209-1
- 213 W Quincy St Unit 1
- 213 W Quincy St Unit 2
- 209 W Quincy St Unit 1
- 207 W Quincy St Unit 1
- 209 W Quincy St Unit 2
- 207 W Quincy St Unit 2
- 211 W Quincy St Unit 211-1
- 211 W Quincy St Unit 211-2
- 211 W Quincy St Unit 2
- 201 W Quincy St
- 199 W Quincy St
- 212 Waubansee Rd
- 208 Waubansee Rd
- 216 Waubansee Rd