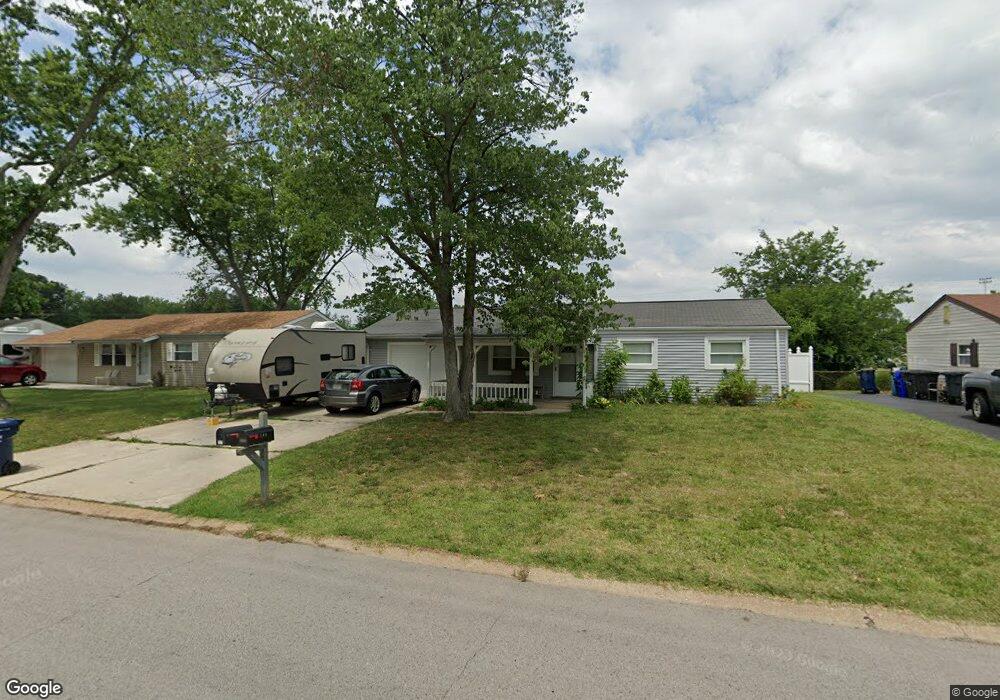
207 Weber Dr Eureka, MO 63025
Estimated Value: $210,563 - $271,000
3
Beds
1
Bath
1,228
Sq Ft
$196/Sq Ft
Est. Value
About This Home
This home is located at 207 Weber Dr, Eureka, MO 63025 and is currently estimated at $240,391, approximately $195 per square foot. 207 Weber Dr is a home located in St. Louis County with nearby schools including Geggie Elementary School, Lasalle Springs Middle School, and Eureka Senior High School.
Ownership History
Date
Name
Owned For
Owner Type
Purchase Details
Closed on
Sep 30, 2021
Sold by
Ross Larry D and Ross Deborah L
Bought by
Holladay Kellie Ann
Current Estimated Value
Home Financials for this Owner
Home Financials are based on the most recent Mortgage that was taken out on this home.
Original Mortgage
$123,500
Outstanding Balance
$111,885
Interest Rate
2.8%
Mortgage Type
New Conventional
Estimated Equity
$128,506
Purchase Details
Closed on
Feb 28, 2007
Sold by
Stevenson Troy H and Stevenson Winnie M
Bought by
Ross Larry D and Ross Deborah L
Home Financials for this Owner
Home Financials are based on the most recent Mortgage that was taken out on this home.
Original Mortgage
$152,900
Interest Rate
6.62%
Mortgage Type
Purchase Money Mortgage
Purchase Details
Closed on
May 6, 2005
Sold by
Dieckmann Linda S
Bought by
Stevenson Troy H and Stevenson Winnie M
Purchase Details
Closed on
Aug 11, 2004
Sold by
Scott Christina
Bought by
Scott Christina and Dieckmann Linda S
Create a Home Valuation Report for This Property
The Home Valuation Report is an in-depth analysis detailing your home's value as well as a comparison with similar homes in the area
Home Values in the Area
Average Home Value in this Area
Purchase History
| Date | Buyer | Sale Price | Title Company |
|---|---|---|---|
| Holladay Kellie Ann | -- | Hillsboro Title | |
| Holladay Kellie Ann | -- | Hillsboro Title | |
| Ross Larry D | $152,900 | None Available | |
| Stevenson Troy H | $120,000 | Tia | |
| Scott Christina | -- | -- |
Source: Public Records
Mortgage History
| Date | Status | Borrower | Loan Amount |
|---|---|---|---|
| Open | Holladay Kellie Ann | $123,500 | |
| Closed | Holladay Kellie Ann | $123,500 | |
| Previous Owner | Ross Larry D | $152,900 |
Source: Public Records
Tax History
| Year | Tax Paid | Tax Assessment Tax Assessment Total Assessment is a certain percentage of the fair market value that is determined by local assessors to be the total taxable value of land and additions on the property. | Land | Improvement |
|---|---|---|---|---|
| 2025 | $2,656 | $38,120 | $15,600 | $22,520 |
| 2024 | $2,656 | $35,580 | $11,700 | $23,880 |
| 2023 | $2,656 | $35,580 | $11,700 | $23,880 |
| 2022 | $2,282 | $28,420 | $11,700 | $16,720 |
| 2021 | $2,266 | $28,420 | $11,700 | $16,720 |
| 2020 | $2,072 | $24,850 | $11,700 | $13,150 |
| 2019 | $2,078 | $24,850 | $11,700 | $13,150 |
| 2018 | $1,938 | $21,870 | $8,570 | $13,300 |
| 2017 | $1,867 | $21,870 | $8,570 | $13,300 |
| 2016 | $1,582 | $17,820 | $6,230 | $11,590 |
| 2015 | $1,569 | $17,820 | $6,230 | $11,590 |
| 2014 | $1,530 | $16,980 | $5,830 | $11,150 |
Source: Public Records
Map
Nearby Homes
- 329 Kevin Jon Ct
- 118 Towne Square Ct Unit D4
- 318 Kevin Jon Ct
- 125 Towne Square Ct Unit 4E
- 345 Palisades Ridge Ct
- 830 Lower Field Ln
- 83 Old Farmhouse Way
- 826 Lower Field Ln
- 75 Old Farmhouse Way
- 808 Lower Field Ln
- 369 Cerny Ave
- 412 Parkview Ln
- 814 Eureka Rd
- 637 N Virginia Ave
- 15 Rockwood Place Ct
- 3 Leona Ln
- 1000 Eureka Rd
- 160 Hunters Run Ct
- 1075 Eureka Rd
- 674 Grandview Ridge Ct
Your Personal Tour Guide
Ask me questions while you tour the home.