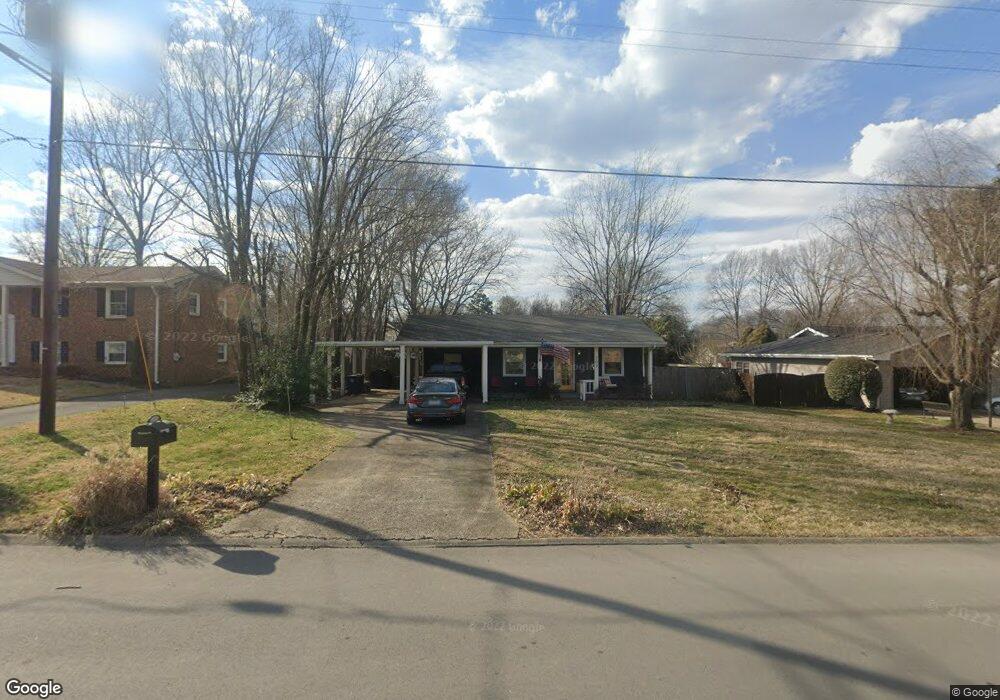
207 Westfield Dr Franklin, TN 37064
West Franklin NeighborhoodEstimated Value: $451,589 - $546,000
--
Bed
2
Baths
1,144
Sq Ft
$428/Sq Ft
Est. Value
About This Home
This home is located at 207 Westfield Dr, Franklin, TN 37064 and is currently estimated at $490,147, approximately $428 per square foot. 207 Westfield Dr is a home located in Williamson County with nearby schools including Johnson Elementary School, Freedom Intermediate School, and Freedom Middle School.
Ownership History
Date
Name
Owned For
Owner Type
Purchase Details
Closed on
Jun 4, 2014
Sold by
Matlock Bradley D and Matlock Fiona
Bought by
Ramey Monica L
Current Estimated Value
Home Financials for this Owner
Home Financials are based on the most recent Mortgage that was taken out on this home.
Original Mortgage
$161,100
Outstanding Balance
$123,452
Interest Rate
4.4%
Mortgage Type
New Conventional
Estimated Equity
$366,695
Purchase Details
Closed on
Jan 22, 2003
Sold by
Matlock Bradley D
Bought by
Matlock Bradley D and Matlock Fiona
Home Financials for this Owner
Home Financials are based on the most recent Mortgage that was taken out on this home.
Original Mortgage
$118,750
Interest Rate
5.98%
Purchase Details
Closed on
May 23, 2001
Sold by
Faith Community Church Of Franklin
Bought by
Matlock Bradley D
Home Financials for this Owner
Home Financials are based on the most recent Mortgage that was taken out on this home.
Original Mortgage
$114,700
Interest Rate
7.14%
Mortgage Type
FHA
Purchase Details
Closed on
Jun 13, 1994
Sold by
Bagsby Daria L
Bought by
Faith Alliance Church
Create a Home Valuation Report for This Property
The Home Valuation Report is an in-depth analysis detailing your home's value as well as a comparison with similar homes in the area
Home Values in the Area
Average Home Value in this Area
Purchase History
| Date | Buyer | Sale Price | Title Company |
|---|---|---|---|
| Ramey Monica L | $179,000 | Wagon Wheel Title | |
| Matlock Bradley D | -- | Lenders Title & Escrow Llc | |
| Matlock Bradley D | $116,500 | Lenders Title & Escrow Llc | |
| Faith Alliance Church | -- | -- |
Source: Public Records
Mortgage History
| Date | Status | Borrower | Loan Amount |
|---|---|---|---|
| Open | Ramey Monica L | $161,100 | |
| Previous Owner | Matlock Bradley D | $118,750 | |
| Previous Owner | Matlock Bradley D | $114,700 |
Source: Public Records
Tax History Compared to Growth
Tax History
| Year | Tax Paid | Tax Assessment Tax Assessment Total Assessment is a certain percentage of the fair market value that is determined by local assessors to be the total taxable value of land and additions on the property. | Land | Improvement |
|---|---|---|---|---|
| 2024 | $2,161 | $76,325 | $27,500 | $48,825 |
| 2023 | $2,077 | $76,325 | $27,500 | $48,825 |
| 2022 | $2,077 | $76,325 | $27,500 | $48,825 |
| 2021 | $2,077 | $76,325 | $27,500 | $48,825 |
| 2020 | $1,653 | $51,225 | $16,875 | $34,350 |
| 2019 | $1,653 | $51,225 | $16,875 | $34,350 |
| 2018 | $1,617 | $51,225 | $16,875 | $34,350 |
| 2017 | $1,592 | $51,225 | $16,875 | $34,350 |
| 2016 | $1,587 | $51,225 | $16,875 | $34,350 |
| 2015 | -- | $36,625 | $13,750 | $22,875 |
| 2014 | -- | $36,625 | $13,750 | $22,875 |
Source: Public Records
Map
Nearby Homes
- 132 Alexander Dr
- 1141 Magnolia Dr
- 5112 Terravista Ln
- 1407 Clairmonte Cir
- 613 Hillsboro Rd Unit D23
- 2009 Heflin Ln
- 1839 William Campbell Ct
- 3126 Bush Dr
- 961 Glass St
- 703 Granville Rd Unit 703
- 959 Glass St
- 305 Abram Ct
- 3126 Annfield Way
- 604 Granville Rd Unit 604
- 100 Cottage Ln
- 928 Glass St
- Azalea Plan at Reese
- Jordan Plan at Reese
- 746 Harrow Ln
- 601 Boyd Mill Ave Unit J1
- 205 Westfield Dr
- 209 Westfield Dr
- 13 Lee Ct
- 203 Westfield Dr
- 211 Westfield Dr
- 12 Lee Ct
- 204 Patrick Ave
- 206 Westfield Dr
- 14 Lee Ct
- 204 Westfield Dr
- 202 Patrick Ave
- 201 Westfield Dr
- 300 Patrick Ave
- 11 Lee Ct
- 101 Alexander Dr
- 202 Westfield Dr
- 200 Patrick Ave
- 209 Patrick Ave
- 200 Westfield Dr
- 207 Patrick Ave