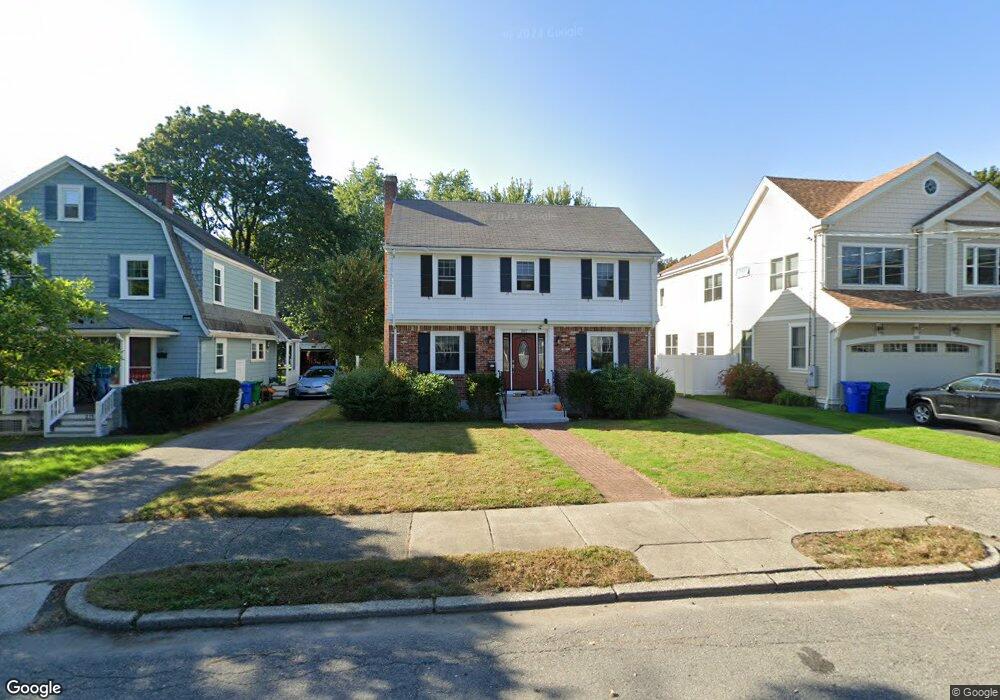
207 Winslow Rd Unit 1 Waban, MA 02468
Newton Highlands NeighborhoodEstimated Value: $1,738,000 - $1,898,000
1
Bed
1
Bath
650
Sq Ft
$2,793/Sq Ft
Est. Value
About This Home
This home is located at 207 Winslow Rd Unit 1, Waban, MA 02468 and is currently estimated at $1,815,272, approximately $2,792 per square foot. 207 Winslow Rd Unit 1 is a home located in Middlesex County with nearby schools including Zervas Elementary School, Oak Hill Middle School, and Newton South High School.
Ownership History
Date
Name
Owned For
Owner Type
Purchase Details
Closed on
Nov 4, 2019
Sold by
Solwin Investment Llc
Bought by
Xing Yinghua
Current Estimated Value
Home Financials for this Owner
Home Financials are based on the most recent Mortgage that was taken out on this home.
Original Mortgage
$780,000
Outstanding Balance
$684,824
Interest Rate
3.5%
Mortgage Type
Purchase Money Mortgage
Estimated Equity
$1,130,448
Purchase Details
Closed on
Mar 2, 2018
Sold by
Szathmary Ellen H
Bought by
Solwin Investment Llc
Home Financials for this Owner
Home Financials are based on the most recent Mortgage that was taken out on this home.
Original Mortgage
$977,500
Interest Rate
4.04%
Mortgage Type
Unknown
Purchase Details
Closed on
Nov 16, 2007
Sold by
Szathmary William
Bought by
Szathmary Ellen H and Szathmary William
Create a Home Valuation Report for This Property
The Home Valuation Report is an in-depth analysis detailing your home's value as well as a comparison with similar homes in the area
Home Values in the Area
Average Home Value in this Area
Purchase History
| Date | Buyer | Sale Price | Title Company |
|---|---|---|---|
| Xing Yinghua | $1,300,000 | -- | |
| Solwin Investment Llc | $770,000 | -- | |
| Szathmary Ellen H | -- | -- |
Source: Public Records
Mortgage History
| Date | Status | Borrower | Loan Amount |
|---|---|---|---|
| Open | Xing Yinghua | $780,000 | |
| Previous Owner | Solwin Investment Llc | $977,500 |
Source: Public Records
Tax History Compared to Growth
Tax History
| Year | Tax Paid | Tax Assessment Tax Assessment Total Assessment is a certain percentage of the fair market value that is determined by local assessors to be the total taxable value of land and additions on the property. | Land | Improvement |
|---|---|---|---|---|
| 2025 | $14,041 | $1,432,800 | $900,200 | $532,600 |
| 2024 | $13,577 | $1,391,100 | $874,000 | $517,100 |
| 2023 | $12,897 | $1,266,900 | $659,800 | $607,100 |
| 2022 | $12,341 | $1,173,100 | $610,900 | $562,200 |
| 2021 | $11,908 | $1,106,700 | $576,300 | $530,400 |
| 2020 | $9,391 | $899,500 | $576,300 | $323,200 |
| 2019 | $8,207 | $785,400 | $559,500 | $225,900 |
| 2018 | $7,856 | $726,100 | $505,300 | $220,800 |
| 2017 | $7,617 | $726,100 | $505,300 | $220,800 |
| 2016 | $7,285 | $640,200 | $445,500 | $194,700 |
| 2015 | $6,946 | $598,300 | $416,400 | $181,900 |
Source: Public Records
Map
Nearby Homes
- 35 Bradford Rd
- 120 Stanley Rd
- 35 Kingston Rd
- 131 Oliver Rd
- 80 Pine Ridge Rd
- 25 Allen Ave
- 200 Lincoln St
- 1077 Boylston St
- 1430 Beacon St
- 17 Circuit Ave Unit 2
- 873 Chestnut St
- 3 Glenmore Terrace Unit 2
- 120 Collins Rd
- 2 Raeburn Terrace
- 103 Thurston Rd
- 18 Annawan Rd
- 513 Chestnut St
- 66 Rockland Place
- 102 Thurston Rd Unit 100
- 20 Kinmonth Rd Unit 203
- 207 Winslow Rd
- 211 Winslow Rd
- 203 Winslow Rd
- 215 Winslow Rd
- 199 Winslow Rd Unit 201
- 193 Winslow Rd Unit 195
- 193 Winslow Rd Unit 193
- 193 Winslow Rd
- 221 Winslow Rd
- 206 Winslow Rd
- 206 Winslow Rd Unit 1
- 212 Winslow Rd
- 202 Winslow Rd
- 192 Beethoven Ave
- 192 Beethoven Ave Unit 192
- 216 Winslow Rd
- 196 Beethoven Ave
- 191 Winslow Rd
- 182 Beethoven Ave
- 182 Beethoven Ave Unit U:2