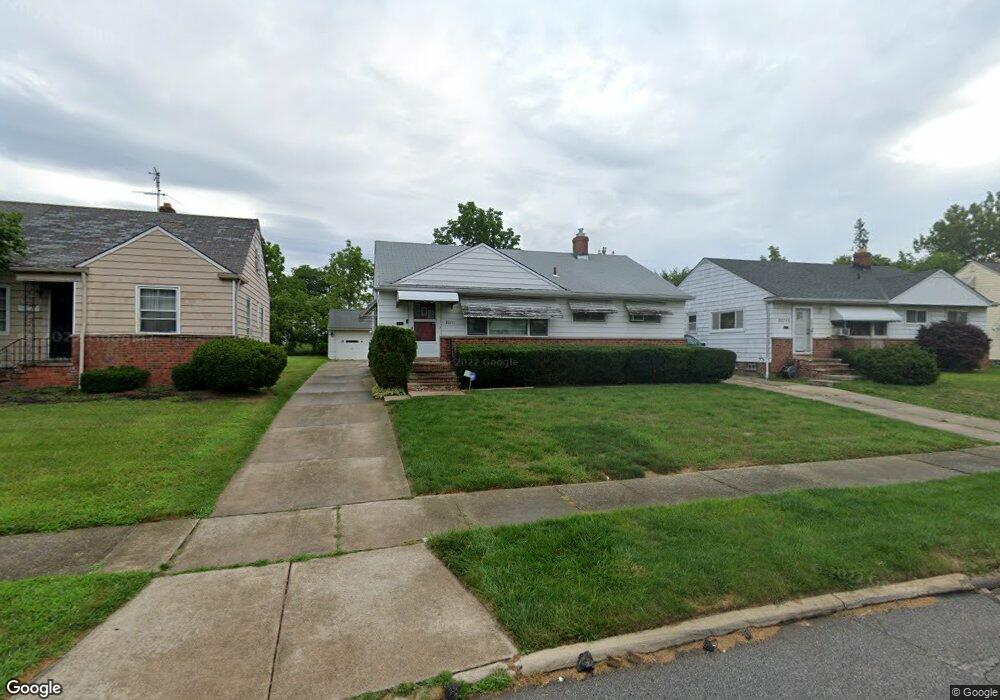
20711 Applegate Rd Maple Heights, OH 44137
Estimated Value: $106,000 - $131,000
3
Beds
1
Bath
1,033
Sq Ft
$118/Sq Ft
Est. Value
About This Home
This home is located at 20711 Applegate Rd, Maple Heights, OH 44137 and is currently estimated at $121,426, approximately $117 per square foot. 20711 Applegate Rd is a home located in Cuyahoga County with nearby schools including Abraham Lincoln Elementary School, Rockside/ J.F. Kennedy School, and Barack Obama School.
Ownership History
Date
Name
Owned For
Owner Type
Purchase Details
Closed on
Apr 28, 2015
Sold by
Hill Rosemarie
Bought by
Martin Victoria L
Current Estimated Value
Purchase Details
Closed on
Feb 13, 1995
Sold by
Zgonc Elizabeth
Bought by
Hill Rosemarie
Home Financials for this Owner
Home Financials are based on the most recent Mortgage that was taken out on this home.
Original Mortgage
$65,600
Interest Rate
9.21%
Mortgage Type
New Conventional
Purchase Details
Closed on
Apr 8, 1988
Sold by
Zgonc Matthew A and Zgonc Elizabeth
Bought by
Zgonc Elizabeth
Purchase Details
Closed on
Aug 31, 1983
Sold by
Zgonc Matthew A and Zgonc Elizabeth
Bought by
Zgonc Matthew A and Zgonc Elizabeth
Purchase Details
Closed on
Jan 1, 1975
Bought by
Zgonc Matthew A and Zgonc Elizabeth
Create a Home Valuation Report for This Property
The Home Valuation Report is an in-depth analysis detailing your home's value as well as a comparison with similar homes in the area
Home Values in the Area
Average Home Value in this Area
Purchase History
| Date | Buyer | Sale Price | Title Company |
|---|---|---|---|
| Martin Victoria L | $19,824 | None Available | |
| Hill Rosemarie | $82,000 | -- | |
| Zgonc Elizabeth | -- | -- | |
| Zgonc Matthew A | -- | -- | |
| Zgonc Matthew A | -- | -- |
Source: Public Records
Mortgage History
| Date | Status | Borrower | Loan Amount |
|---|---|---|---|
| Previous Owner | Hill Rosemarie | $65,600 |
Source: Public Records
Tax History
| Year | Tax Paid | Tax Assessment Tax Assessment Total Assessment is a certain percentage of the fair market value that is determined by local assessors to be the total taxable value of land and additions on the property. | Land | Improvement |
|---|---|---|---|---|
| 2024 | $3,785 | $42,350 | $7,385 | $34,965 |
| 2023 | $2,940 | $28,140 | $4,900 | $23,240 |
| 2022 | $2,929 | $28,140 | $4,900 | $23,240 |
| 2021 | $3,127 | $28,140 | $4,900 | $23,240 |
| 2020 | $2,662 | $21,320 | $3,710 | $17,610 |
| 2019 | $2,534 | $60,900 | $10,600 | $50,300 |
| 2018 | $1,876 | $21,320 | $3,710 | $17,610 |
| 2017 | $2,712 | $21,560 | $3,710 | $17,850 |
| 2016 | $2,509 | $21,560 | $3,710 | $17,850 |
| 2015 | $3,587 | $21,560 | $3,710 | $17,850 |
| 2014 | $3,587 | $23,700 | $4,060 | $19,640 |
Source: Public Records
Map
Nearby Homes
- 21202 Gardenview Dr
- 21607 Libby Rd
- 123 Willard Ave
- 5424 Fairtree Rd
- 339 Grand Blvd
- 54 Willard Ave
- 19113 Watercrest Ave
- 20806 Clare Ave
- 66 Hubbell Way
- 58 Hubbell Way
- 62 Hubbell Way
- 54 Hubbell Way
- 0 Hubbell Cir
- 21202 Hillgrove Ave
- 61 Hubbell Way
- 419 Center Rd
- 57 Hubbell Way
- 21860 Louis Rd
- 21600 Franklin Rd
- 21207 Franklin Rd
- 20707 Applegate Rd
- 20715 Applegate Rd
- 20703 Applegate Rd
- 20719 Applegate Rd
- 20714 Bowling Green Rd
- 20710 Bowling Green Rd
- 20718 Bowling Green Rd
- 20706 Bowling Green Rd
- 20699 Applegate Rd
- 20723 Applegate Rd
- 20722 Bowling Green Rd
- 20712 Applegate Rd
- 20716 Applegate Rd
- 20708 Applegate Rd
- 20702 Bowling Green Rd
- 20726 Bowling Green Rd
- 20720 Applegate Rd
- 20704 Applegate Rd
- 20727 Applegate Rd
- 20695 Applegate Rd
Your Personal Tour Guide
Ask me questions while you tour the home.