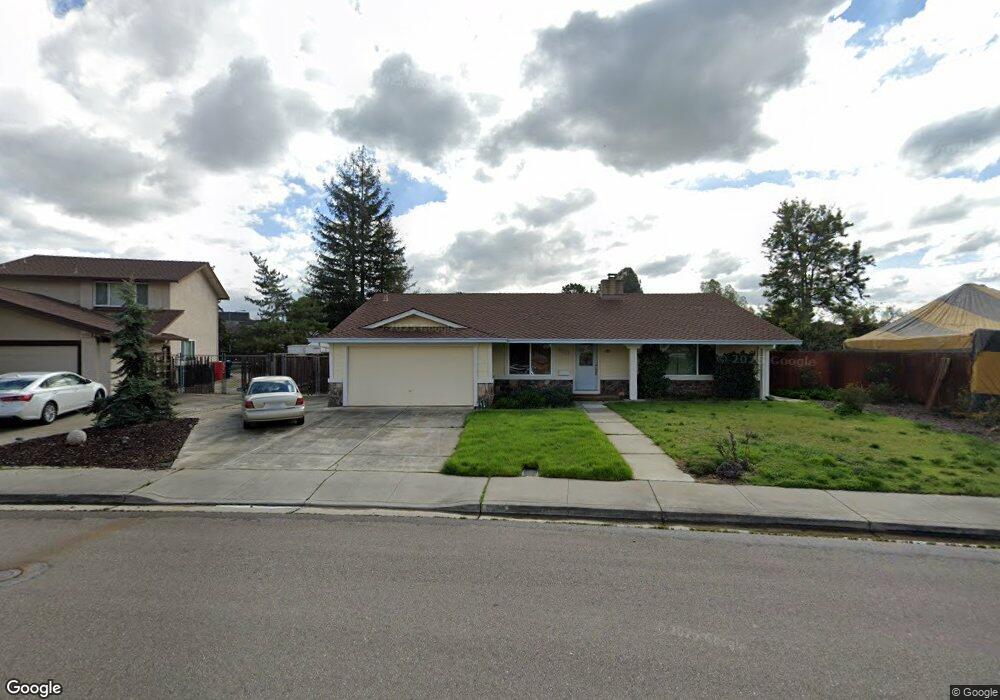
2072 Helsinki Way Livermore, CA 94550
Sunset East NeighborhoodEstimated Value: $1,080,000 - $1,648,000
5
Beds
2
Baths
2,300
Sq Ft
$610/Sq Ft
Est. Value
About This Home
This home is located at 2072 Helsinki Way, Livermore, CA 94550 and is currently estimated at $1,402,637, approximately $609 per square foot. 2072 Helsinki Way is a home located in Alameda County with nearby schools including William Mendenhall Middle School, Granada High School, and St Michael's School.
Ownership History
Date
Name
Owned For
Owner Type
Purchase Details
Closed on
Nov 20, 2020
Sold by
Barr Orville C and The Orville Barr Trust
Bought by
Heal Ryan Mcgavin and Heal Benjamin Lindsay
Current Estimated Value
Home Financials for this Owner
Home Financials are based on the most recent Mortgage that was taken out on this home.
Original Mortgage
$688,000
Outstanding Balance
$618,921
Interest Rate
2.8%
Mortgage Type
New Conventional
Estimated Equity
$783,716
Purchase Details
Closed on
Dec 28, 2011
Sold by
Barr Orville and Orville Barr Trust
Bought by
Barr Orville C and Orville C Barr Trust
Purchase Details
Closed on
Dec 17, 2008
Sold by
Barr Orville C
Bought by
Barr Orville and Orville Barr Trust
Create a Home Valuation Report for This Property
The Home Valuation Report is an in-depth analysis detailing your home's value as well as a comparison with similar homes in the area
Home Values in the Area
Average Home Value in this Area
Purchase History
| Date | Buyer | Sale Price | Title Company |
|---|---|---|---|
| Heal Ryan Mcgavin | $860,000 | Old Republic Title Company | |
| Barr Orville C | -- | None Available | |
| Barr Orville | -- | None Available |
Source: Public Records
Mortgage History
| Date | Status | Borrower | Loan Amount |
|---|---|---|---|
| Open | Heal Ryan Mcgavin | $688,000 |
Source: Public Records
Tax History Compared to Growth
Tax History
| Year | Tax Paid | Tax Assessment Tax Assessment Total Assessment is a certain percentage of the fair market value that is determined by local assessors to be the total taxable value of land and additions on the property. | Land | Improvement |
|---|---|---|---|---|
| 2025 | $11,425 | $923,880 | $279,264 | $651,616 |
| 2024 | $11,425 | $905,631 | $273,789 | $638,842 |
| 2023 | $11,264 | $894,743 | $268,423 | $626,320 |
| 2022 | $11,111 | $870,200 | $263,160 | $614,040 |
| 2021 | $10,150 | $853,000 | $258,000 | $602,000 |
| 2020 | $3,669 | $256,196 | $110,477 | $145,719 |
| 2019 | $3,671 | $251,173 | $108,311 | $142,862 |
| 2018 | $3,574 | $246,249 | $106,188 | $140,061 |
| 2017 | $3,466 | $241,421 | $104,106 | $137,315 |
| 2016 | $3,314 | $236,688 | $102,065 | $134,623 |
| 2015 | $3,109 | $233,133 | $100,532 | $132,601 |
| 2014 | $3,048 | $228,567 | $98,563 | $130,004 |
Source: Public Records
Map
Nearby Homes
- 2215 Chardonnay Way
- 1467 Hudson Way
- 1307 Belfast Ct
- 2772 San Minete Dr
- 2203 Sherry Ct
- 1153 Sherry Way
- 2597 Ancona Cir
- 528 S S St
- 589 S M St
- 1087 Murrieta Blvd Unit 243
- 1087 Murrieta Blvd Unit 138
- 1087 Murrieta Blvd Unit 245
- 1087 Murrieta Blvd Unit 242
- 1085 Murrieta Blvd Unit 318
- 1085 Murrieta Blvd Unit 222
- 1446 Chateau Common Unit 208
- 628 Lido Dr
- 578 Regulus Rd
- 905 S Livermore Ave
- 1727 2nd St
- 2064 Helsinki Way
- 2080 Helsinki Way
- 1707 Heidelberg Dr
- 2056 Helsinki Way
- 1759 Heidelberg Dr
- 1774 Sterling Ct
- 2061 Helsinki Way
- 1748 Heidelberg Dr
- 2048 Helsinki Way
- 1730 Heidelberg Dr
- 1783 Heidelberg Dr
- 1752 Sterling Ct
- 1756 Heidelberg Dr
- 1685 Heidelberg Dr
- 1812 Sterling Place
- 1714 Heidelberg Dr
- 2057 Helsinki Way
- 1772 Heidelberg Dr
- 2032 Helsinki Way
- 1791 Heidelberg Dr