


20729 S Barker Rd Spring Hill, KS 66083
Estimated payment $2,997/month
Total Views
15,125
4
Beds
2.5
Baths
2,881
Sq Ft
$163
Price per Sq Ft
Highlights
- Very Popular Property
- Pond
- Wood Flooring
- Deck
- Traditional Architecture
- Outdoor Kitchen
About This Home
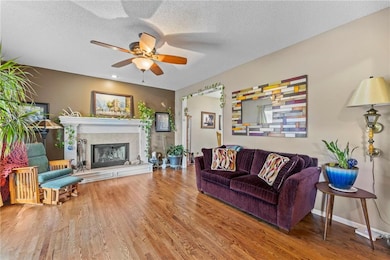
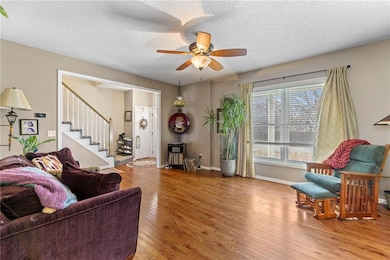
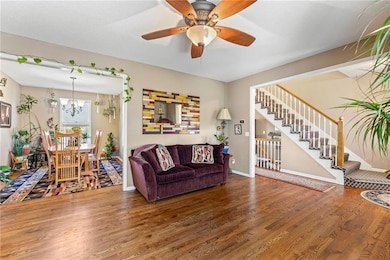
Beautifully maintained 4-bedroom, 2.5-bath home in a desirable, friendly neighborhood. Thoughtful updates and pride of ownership shine throughout, with bright, open living spaces perfect for everyday life and entertaining. The main floor features new hardwoods throughout, a welcoming entry, a spacious living room, and a dining area that flows into a well-equipped kitchen. Upstairs offers all-new carpet, a private primary suite and additional bedrooms for comfort and flexibility. Major recent updates include a new roof, new Andersen windows, and a new 4-ton HVAC system with whole-home humidifier. The finished walkout basement adds versatile living space — ideal for a family room, home office, or guest suite. Outside, enjoy a beautifully manicured, mature yard with lush landscaping and a serene lake view just beyond the back door. Relax or entertain around the cozy fire pit while taking in peaceful water vistas and soothing sunsets. Attached garage, ample storage, and a convenient location close to parks, schools, and shopping make this move-in-ready gem an ideal blend of style, comfort, and modern efficiency.
Listing Agent
Crown Realty Brokerage Phone: 620-228-1413 License #00228497 Listed on: 10/31/2025
Home Details
Home Type
- Single Family
Est. Annual Taxes
- $6,000
Year Built
- Built in 2003
Lot Details
- 9,000 Sq Ft Lot
- Lot Dimensions are 75x120
- Paved or Partially Paved Lot
- Level Lot
HOA Fees
- $27 Monthly HOA Fees
Parking
- 2 Car Attached Garage
- Front Facing Garage
Home Design
- Traditional Architecture
- Frame Construction
- Composition Roof
- Lap Siding
Interior Spaces
- 2-Story Property
- Ceiling Fan
- Wood Burning Fireplace
- Thermal Windows
- Family Room with Fireplace
- Family Room Downstairs
- Formal Dining Room
- Finished Basement
- Basement Fills Entire Space Under The House
- Fire and Smoke Detector
Kitchen
- Dishwasher
- Kitchen Island
- Disposal
Flooring
- Wood
- Carpet
Bedrooms and Bathrooms
- 4 Bedrooms
Laundry
- Laundry Room
- Dryer Hookup
Outdoor Features
- Pond
- Deck
- Outdoor Kitchen
- Porch
Location
- City Lot
Schools
- Wolf Creek Elementary School
- Spring Hill High School
Utilities
- Central Air
- Heat Pump System
Listing and Financial Details
- Assessor Parcel Number EP98000000 0019
- $85 special tax assessment
Community Details
Overview
- Association fees include partial amenities
- Woodland Ridge Subdivision
Recreation
- Community Pool
Map
Create a Home Valuation Report for This Property
The Home Valuation Report is an in-depth analysis detailing your home's value as well as a comparison with similar homes in the area
Home Values in the Area
Average Home Value in this Area
Tax History
| Year | Tax Paid | Tax Assessment Tax Assessment Total Assessment is a certain percentage of the fair market value that is determined by local assessors to be the total taxable value of land and additions on the property. | Land | Improvement |
|---|---|---|---|---|
| 2024 | $5,999 | $42,826 | $10,129 | $32,697 |
| 2023 | $5,653 | $40,204 | $9,202 | $31,002 |
| 2022 | $5,030 | $35,535 | $8,371 | $27,164 |
| 2021 | $4,748 | $32,626 | $6,976 | $25,650 |
| 2020 | $4,590 | $30,475 | $6,342 | $24,133 |
| 2019 | $4,197 | $27,864 | $5,768 | $22,096 |
| 2018 | $3,735 | $25,622 | $5,768 | $19,854 |
| 2017 | $3,681 | $25,001 | $4,807 | $20,194 |
| 2016 | $3,397 | $22,989 | $4,561 | $18,428 |
| 2015 | $3,363 | $22,736 | $4,561 | $18,175 |
| 2013 | -- | $21,103 | $4,561 | $16,542 |
Source: Public Records
Property History
| Date | Event | Price | List to Sale | Price per Sq Ft |
|---|---|---|---|---|
| 12/07/2025 12/07/25 | Price Changed | $470,000 | -1.1% | $163 / Sq Ft |
| 11/06/2025 11/06/25 | For Sale | $475,000 | -- | $165 / Sq Ft |
Source: Heartland MLS
Purchase History
| Date | Type | Sale Price | Title Company |
|---|---|---|---|
| Interfamily Deed Transfer | -- | None Available | |
| Warranty Deed | -- | Security Land Title Company |
Source: Public Records
Mortgage History
| Date | Status | Loan Amount | Loan Type |
|---|---|---|---|
| Open | $176,825 | Purchase Money Mortgage |
Source: Public Records
About the Listing Agent
Jennifer's Other Listings
Source: Heartland MLS
MLS Number: 2584618
APN: EP98000000-0019
Disclaimer: Certain information contained herein is derived from information provided by parties other than Homes.com. All information provided is deemed reliable, but is not guaranteed to be accurate and should be independently verified.
![]() Based on information submitted to the MLS GRID as of [see last changed date above]. All data is obtained from various sources and may not have been verified by broker or MLS GRID. Supplied Open House Information is subject to change without notice. All information should be independently reviewed and verified for accuracy. Properties may or may not be listed by the office/agent presenting the information. Some IDX listings have been excluded from this website. Prices displayed on all Sold listings are the Last Known Listing Price and may not be the actual selling price.
Based on information submitted to the MLS GRID as of [see last changed date above]. All data is obtained from various sources and may not have been verified by broker or MLS GRID. Supplied Open House Information is subject to change without notice. All information should be independently reviewed and verified for accuracy. Properties may or may not be listed by the office/agent presenting the information. Some IDX listings have been excluded from this website. Prices displayed on all Sold listings are the Last Known Listing Price and may not be the actual selling price.
Listing Information presented by local MLS brokerage: TEN-X, INC., local REALTOR®- Arlene Richardson - (888)952-6393
The Digital Millennium Copyright Act of 1998, 17 U.S.C. § 512 (the “DMCA”) provides recourse for copyright owners who believe that material appearing on the Internet infringes their rights under U.S. copyright law. If you believe in good faith that any content or material made available in connection with our website or services infringes your copyright, you (or your agent) may send us a notice requesting that the content or material be removed, or access to it blocked.
Notices must be sent in writing by email to DMCAnotice@MLSGrid.com.
The DMCA requires that your notice of alleged copyright infringement include the following information:
(1) description of the copyrighted work that is the subject of claimed infringement;
(2) description of the alleged infringing content and information sufficient to permit us to locate the content;
(3) contact information for you, including your address, telephone number and email address;
(4) a statement by you that you have a good faith belief that the content in the manner complained of is not authorized by the copyright owner, or its agent, or by the operation of any law;
(5) a statement by you, signed under penalty of perjury, that the information in the notification is accurate and that you have the authority to enforce the copyrights that are claimed to be infringed; and
(6) a physical or electronic signature of the copyright owner or a person authorized to act on the copyright owner’s behalf. Failure to include all of the above information may result in the delay of the processing of your complaint.
Nearby Homes
- 20727 Emerald St
- 20664 Barker St
- Allen Plan at Hidden Hills
- Gonzalez Plan at Hidden Hills
- 20632 Barker St
- Shields Plan at Hidden Hills
- Lacey Plan at Hidden Hills
- Paige Plan at Hidden Hills
- Bell Plan at Hidden Hills
- Thomas Plan at Hidden Hills
- Hill Plan at Hidden Hills
- 20786 Emerald St
- 20640 Barker St
- 20774 Emerald St
- 19441 W 208th St
- 20668 Skyview Ln
- 20662 Skyview Ln
- 20689 Skyview Ln
- 20644 Skyview Ln
- 20620 Skyview Ln
- 20680 S Barker St
- 200-450 E Wilson St
- 19613 W 200th St
- 19616 W 199th Terrace
- 21541 S Main St
- 21031 Millridge St
- 21203 W 216th Terrace
- 19979 Cornice St
- 19987 Cornice St
- 19637 W 200th St
- 22650 S Harrison St
- 16894 S Bell Rd
- 25901 W 178th St
- 16364 S Ryckert St
- 15450 S Brentwood St
- 18851 W 153rd Ct
- 18417 Spruce St
- 15140 W 157th Terrace
- 29604 W 185th St
- 30125 W 187th St