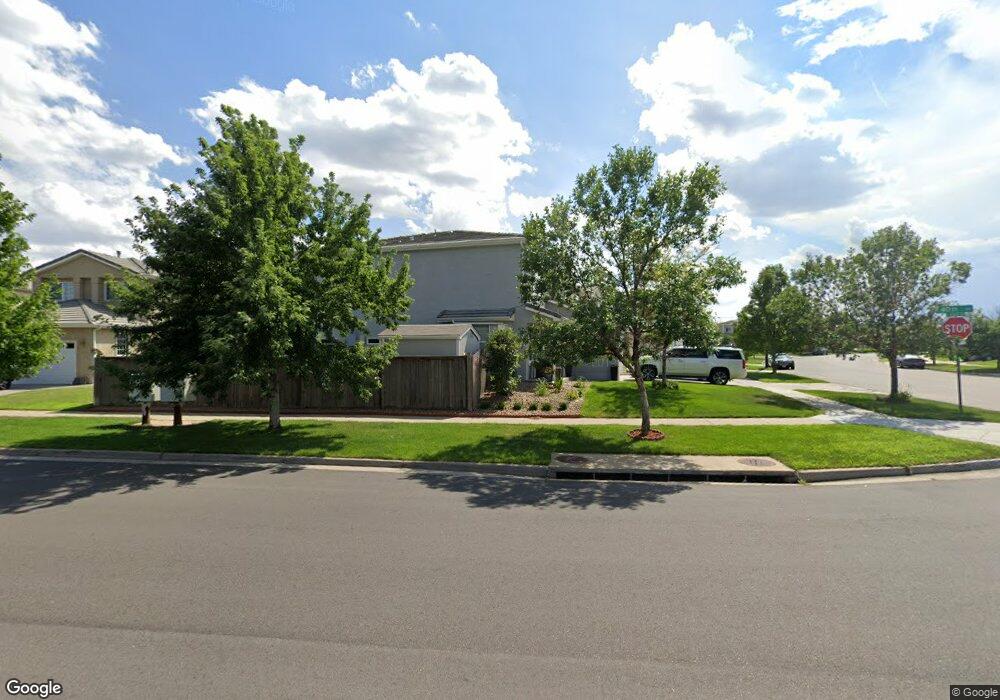
20730 E 40th Ave Denver, CO 80249
Green Valley Ranch NeighborhoodEstimated Value: $474,000 - $501,000
3
Beds
3
Baths
1,988
Sq Ft
$243/Sq Ft
Est. Value
About This Home
This home is located at 20730 E 40th Ave, Denver, CO 80249 and is currently estimated at $482,813, approximately $242 per square foot. 20730 E 40th Ave is a home located in Denver County with nearby schools including Green Valley Elementary School, Pitt-Waller K-8 School, and McGlone Academy.
Ownership History
Date
Name
Owned For
Owner Type
Purchase Details
Closed on
Jan 10, 2017
Sold by
Brunner Eric
Bought by
Colula Lorenzo Ortiz
Current Estimated Value
Home Financials for this Owner
Home Financials are based on the most recent Mortgage that was taken out on this home.
Original Mortgage
$225,000
Outstanding Balance
$182,219
Interest Rate
3.87%
Mortgage Type
Adjustable Rate Mortgage/ARM
Estimated Equity
$300,594
Purchase Details
Closed on
Aug 15, 2003
Sold by
Mcneil Willie Charles
Bought by
Brunner Eric
Home Financials for this Owner
Home Financials are based on the most recent Mortgage that was taken out on this home.
Original Mortgage
$216,500
Interest Rate
5.51%
Mortgage Type
Purchase Money Mortgage
Purchase Details
Closed on
Jun 21, 2002
Sold by
Oakwood Homes Llc
Bought by
Mcneil Willie Charles
Home Financials for this Owner
Home Financials are based on the most recent Mortgage that was taken out on this home.
Original Mortgage
$177,500
Interest Rate
8.95%
Create a Home Valuation Report for This Property
The Home Valuation Report is an in-depth analysis detailing your home's value as well as a comparison with similar homes in the area
Home Values in the Area
Average Home Value in this Area
Purchase History
| Date | Buyer | Sale Price | Title Company |
|---|---|---|---|
| Colula Lorenzo Ortiz | $300,000 | Land Title Guarantee | |
| Brunner Eric | $216,500 | Lawyers Title Ins | |
| Mcneil Willie Charles | $213,943 | Stewart Title | |
| Oakwood Homes Llc | -- | Stewart Title |
Source: Public Records
Mortgage History
| Date | Status | Borrower | Loan Amount |
|---|---|---|---|
| Open | Colula Lorenzo Ortiz | $225,000 | |
| Previous Owner | Brunner Eric | $216,500 | |
| Previous Owner | Mcneil Willie Charles | $177,500 |
Source: Public Records
Tax History
| Year | Tax Paid | Tax Assessment Tax Assessment Total Assessment is a certain percentage of the fair market value that is determined by local assessors to be the total taxable value of land and additions on the property. | Land | Improvement |
|---|---|---|---|---|
| 2025 | $2,949 | $34,750 | $6,600 | $6,600 |
| 2024 | $2,949 | $31,270 | $2,590 | $28,680 |
| 2023 | $2,798 | $31,270 | $2,590 | $28,680 |
| 2022 | $2,553 | $25,630 | $5,210 | $20,420 |
| 2021 | $2,498 | $26,370 | $5,360 | $21,010 |
| 2020 | $2,330 | $24,710 | $4,460 | $20,250 |
| 2019 | $2,279 | $24,710 | $4,460 | $20,250 |
| 2018 | $2,064 | $21,180 | $3,590 | $17,590 |
| 2017 | $2,059 | $21,180 | $3,590 | $17,590 |
| 2016 | $1,752 | $17,240 | $3,479 | $13,761 |
| 2015 | $1,693 | $17,240 | $3,479 | $13,761 |
| 2014 | $1,165 | $11,290 | $2,388 | $8,902 |
Source: Public Records
Map
Nearby Homes
- 20604 E 38th Place
- 3880 N Jebel St
- 3953 Ireland St
- 4192 Ireland Ct
- 4201 Ireland St
- 4312 Kirk Ct
- 20420 Kelly Place
- 20000 E Mitchell Place Unit 71
- 20000 Mitchell Place Unit 9
- 20000 Mitchell Place Unit 45
- 4029 Orleans St
- 20762 E 44th Ave
- 20927 Kelly Place
- 21535 E 39th Ave
- 4250 Perth Cir
- 4116 Orleans St
- 4087 Orleans Ct
- 4125 Orleans Ct
- 4315 Orleans St
- 21480 E 42nd Ave
- 20720 E 40th Ave
- 20740 E 40th Ave
- 20710 E 40th Ave
- 20742 E 40th Ave
- 20750 E 40th Ave
- 20717 E 39th Ave
- 20727 E 39th Ave
- 20741 E 40th Ave
- 20731 E 40th Ave
- 20737 E 39th Ave
- 3994 Kirk St
- 20694 E 41st Ave
- 3904 Kirk St
- 20752 E 40th Ave
- 20745 E 39th Ave
- 20721 E 40th Ave
- 20760 E 40th Ave
- 20747 E 39th Ave
- 20674 E 41st Ave
- 20701 E 40th Ave
Your Personal Tour Guide
Ask me questions while you tour the home.