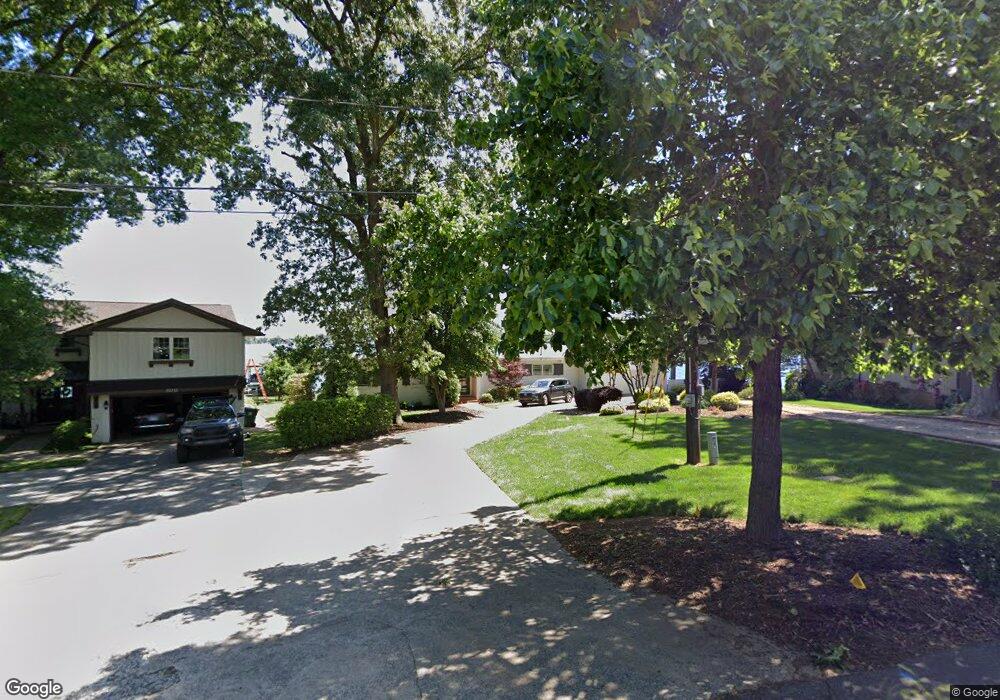
20730 Eastpoint Dr Unit 72 & 73 Cornelius, NC 28031
Estimated Value: $2,396,000 - $2,916,000
4
Beds
3
Baths
3,491
Sq Ft
$763/Sq Ft
Est. Value
About This Home
This home is located at 20730 Eastpoint Dr Unit 72 & 73, Cornelius, NC 28031 and is currently estimated at $2,664,160, approximately $763 per square foot. 20730 Eastpoint Dr Unit 72 & 73 is a home located in Mecklenburg County with nearby schools including Cornelius Elementary School, Bailey Middle School, and William Amos Hough High School.
Ownership History
Date
Name
Owned For
Owner Type
Purchase Details
Closed on
May 22, 2023
Sold by
Kurtz Gerald T and Kurtz Amy A
Bought by
Johnsen Peter and Cadley Patricia
Current Estimated Value
Purchase Details
Closed on
Aug 30, 2016
Sold by
Baugh Thomas W and Baugh Maya L
Bought by
Kurtz Gerald T and Kurtz Amy A
Home Financials for this Owner
Home Financials are based on the most recent Mortgage that was taken out on this home.
Original Mortgage
$295,000
Interest Rate
2.74%
Mortgage Type
New Conventional
Purchase Details
Closed on
Jun 15, 2001
Sold by
Nelson Carolyn Y and Nelson James F
Bought by
Baugh Thomas W and Baugh Maya L
Home Financials for this Owner
Home Financials are based on the most recent Mortgage that was taken out on this home.
Original Mortgage
$382,500
Interest Rate
7.11%
Create a Home Valuation Report for This Property
The Home Valuation Report is an in-depth analysis detailing your home's value as well as a comparison with similar homes in the area
Home Values in the Area
Average Home Value in this Area
Purchase History
| Date | Buyer | Sale Price | Title Company |
|---|---|---|---|
| Johnsen Peter | $2,700,000 | None Listed On Document | |
| Kurtz Gerald T | $950,000 | None Available | |
| Baugh Thomas W | $425,000 | -- |
Source: Public Records
Mortgage History
| Date | Status | Borrower | Loan Amount |
|---|---|---|---|
| Previous Owner | Kurtz Gerald T | $295,000 | |
| Previous Owner | Baugh Thomas W | $382,500 |
Source: Public Records
Tax History Compared to Growth
Tax History
| Year | Tax Paid | Tax Assessment Tax Assessment Total Assessment is a certain percentage of the fair market value that is determined by local assessors to be the total taxable value of land and additions on the property. | Land | Improvement |
|---|---|---|---|---|
| 2025 | -- | $1,987,100 | $1,201,800 | $785,300 |
| 2024 | -- | $1,948,200 | $1,201,800 | $746,400 |
| 2023 | $8,252 | $1,749,400 | $1,201,800 | $547,600 |
| 2022 | $8,252 | $983,700 | $575,000 | $408,700 |
| 2021 | $8,252 | $983,700 | $575,000 | $408,700 |
| 2020 | $8,216 | $979,400 | $575,000 | $404,400 |
| 2019 | $8,250 | $979,400 | $575,000 | $404,400 |
| 2018 | $9,116 | $842,900 | $700,000 | $142,900 |
| 2017 | $9,049 | $842,900 | $700,000 | $142,900 |
| 2016 | $9,045 | $842,900 | $700,000 | $142,900 |
| 2015 | -- | $842,900 | $700,000 | $142,900 |
| 2014 | -- | $842,900 | $700,000 | $142,900 |
Source: Public Records
Map
Nearby Homes
- 20732 Eastpoint Dr
- 21107 Island Forest Dr
- 20509 Island Forest Dr
- 20428 Island Forest Dr
- 20338 Christofle Dr
- 20321 Bethelwood Ln
- 20845 Lagoona Dr
- 20711 Bethel Church Rd
- 20517 Queensdale Dr
- 19934 Walter Henderson Rd
- 20305 Queensdale Dr
- 19624 Meta Rd
- 20314 Colony Point Ln
- 19525 Mary Ardrey Cir
- 19040 Mary Ardrey Cir
- 21228 Lakeview Cir
- 20114 Norman Colony Rd
- 20615 Rio Oro Dr
- 21316 Country Club Ln
- 20324 Middletown Rd
- 20730 Eastpoint Dr
- 20726 Eastpoint Dr
- 20802 Eastpoint Dr
- 20722 Eastpoint Dr
- 20812 Eastpoint Dr
- 20718 Eastpoint Dr
- 20714 Eastpoint Dr
- 20813 Eastpoint Dr
- 20733 Eastpoint Dr
- 21239 Island Forest Dr
- 20721 Eastpoint Dr
- 21307 Island Forest Dr
- 21237 Island Forest Dr
- 20710 Eastpoint Dr
- 21313 Island Forest Dr
- 21313 Island Forest Dr Unit 113
- 21227 Island Forest Dr
- 21225 Island Forest Dr
- 20609 Lakehurst Ct
- 20708 Island Forest Dr