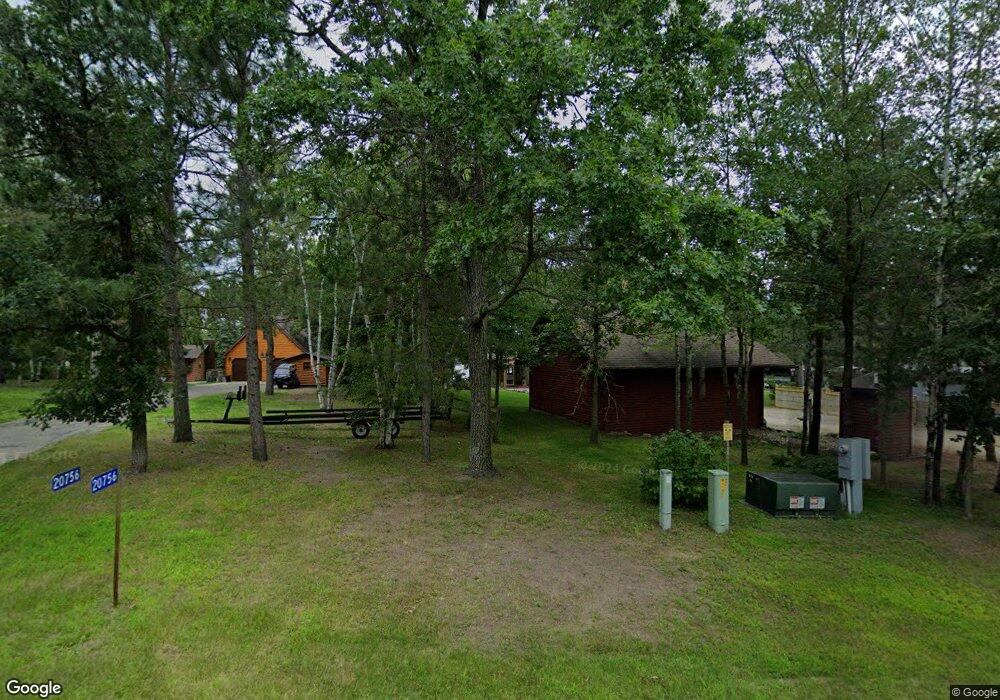
20734 Forest Park Dr Park Rapids, MN 56470
Estimated Value: $280,000 - $433,000
1
Bed
1
Bath
287
Sq Ft
$1,267/Sq Ft
Est. Value
About This Home
This home is located at 20734 Forest Park Dr, Park Rapids, MN 56470 and is currently estimated at $363,616, approximately $1,266 per square foot. 20734 Forest Park Dr is a home located in Hubbard County with nearby schools including Century Elementary School, Century School, and Park Rapids Area High School.
Ownership History
Date
Name
Owned For
Owner Type
Purchase Details
Closed on
Oct 2, 2020
Sold by
Joelson Susan J
Bought by
Suchan Adam
Current Estimated Value
Purchase Details
Closed on
Jan 22, 2020
Sold by
Willette Robert C and Willette Darlene J
Bought by
Joelson Susan J
Purchase Details
Closed on
Aug 14, 2017
Sold by
Landt Douglas T and Landt Ruth N
Bought by
Willette Robert C and Willette Darlene J
Purchase Details
Closed on
May 17, 2013
Sold by
Brann Jack J and Brann Trisha
Bought by
Landt Douglas T and Landt Ruth N
Purchase Details
Closed on
Oct 10, 2007
Sold by
Stockwell Thomas
Bought by
Rossman Mariln R
Purchase Details
Closed on
Sep 28, 2007
Sold by
Walden Thomas R and Walden Patricia
Bought by
Rossman Marilyn R
Purchase Details
Closed on
Sep 7, 2007
Sold by
Rossman Louis A and Rossman Marilyn R
Bought by
Brann Jack J and Brann Trisha A
Create a Home Valuation Report for This Property
The Home Valuation Report is an in-depth analysis detailing your home's value as well as a comparison with similar homes in the area
Home Values in the Area
Average Home Value in this Area
Purchase History
| Date | Buyer | Sale Price | Title Company |
|---|---|---|---|
| Suchan Adam | -- | None Available | |
| Joelson Susan J | $126,500 | None Available | |
| Willette Robert C | $120,000 | Leer Title Service | |
| Landt Douglas T | $95,000 | Leer Title | |
| Rossman Mariln R | -- | None Available | |
| Rossman Marilyn R | -- | None Available | |
| Brann Jack J | $80,000 | None Available |
Source: Public Records
Tax History
| Year | Tax Paid | Tax Assessment Tax Assessment Total Assessment is a certain percentage of the fair market value that is determined by local assessors to be the total taxable value of land and additions on the property. | Land | Improvement |
|---|---|---|---|---|
| 2024 | $2,076 | $323,200 | $102,800 | $220,400 |
| 2023 | $1,830 | $267,300 | $96,900 | $170,400 |
| 2022 | $1,622 | $297,500 | $94,200 | $203,300 |
| 2021 | $526 | $189,300 | $75,900 | $113,400 |
| 2020 | $682 | $59,300 | $45,445 | $13,855 |
| 2019 | $752 | $83,700 | $65,000 | $18,700 |
| 2018 | $732 | $84,000 | $66,400 | $17,600 |
| 2016 | $774 | $83,400 | $66,400 | $17,000 |
| 2015 | $780 | $90,900 | $72,300 | $18,600 |
| 2014 | $844 | $97,800 | $81,800 | $16,000 |
Source: Public Records
Map
Nearby Homes
- 13330 Ermine Dr
- 11100 Fisher Ln
- 12824 Everlasting Dr
- 11944 County 32
- 900 Park Ave N Unit 5
- 20403 County 1
- 716 Park Ave N Unit 3
- 503 Lake Ave
- 13895 Gazelle Trail
- 14588 230th St
- 806 Central Ave N
- 15861 Fortune Dr
- 603 7th St W
- 14612 Gazebo Dr Unit 21
- 107 Grove Ave N
- 707 Bridge St
- TBD Lot 1 Fairway Trail
- 1003 North St E
- 900 Pleasant Ave S
- 1008 Sunrise Cir
- T B D Forest Park Dr
- 20756 Forest Park Dr
- 20716 Forest Park Dr
- 20700 Forest Park Dr
- 20778 Forest Park Dr
- 20778 Forest Park Dr
- 20672 Forest Park Dr
- 20806 Forest Park Dr
- 20652 Forest Park Dr
- 20602 Forest Park Dr
- 20572 Forest Park Dr
- 20520 Forest Park Dr
- 20506 Forest Park Dr
- 20462 Forest Park Dr
- T B D Forest Park Dr
- 20458 Forest Park Dr
- 12134 Fishermans Dr
- TBD1 Fishermans Dr
- 20575 Us 71
- 12101 Fishermans Dr
Your Personal Tour Guide
Ask me questions while you tour the home.