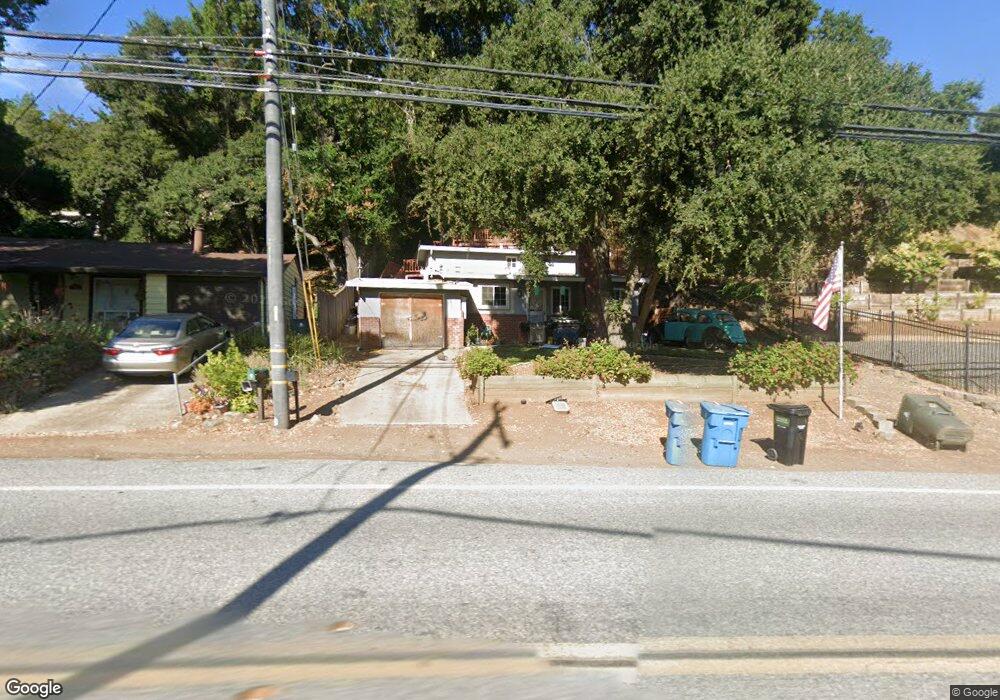
20745 Almaden Rd San Jose, CA 95120
Estimated Value: $1,058,557 - $1,452,000
2
Beds
1
Bath
924
Sq Ft
$1,341/Sq Ft
Est. Value
About This Home
This home is located at 20745 Almaden Rd, San Jose, CA 95120 and is currently estimated at $1,239,139, approximately $1,341 per square foot. 20745 Almaden Rd is a home located in Santa Clara County with nearby schools including Graystone Elementary School, Bret Harte Middle School, and Leland High School.
Ownership History
Date
Name
Owned For
Owner Type
Purchase Details
Closed on
Oct 15, 1999
Sold by
Huck Lansing S
Bought by
Leeburn Vincent
Current Estimated Value
Home Financials for this Owner
Home Financials are based on the most recent Mortgage that was taken out on this home.
Original Mortgage
$260,550
Outstanding Balance
$78,851
Interest Rate
7.86%
Estimated Equity
$1,160,288
Purchase Details
Closed on
Jun 10, 1998
Sold by
Britton James A and Britton Helen D
Bought by
Huck Lansing S
Home Financials for this Owner
Home Financials are based on the most recent Mortgage that was taken out on this home.
Original Mortgage
$186,750
Interest Rate
9.7%
Purchase Details
Closed on
Jul 16, 1997
Sold by
Britton James A and Britton Helen D
Bought by
Britton James A and Britton Helen D
Create a Home Valuation Report for This Property
The Home Valuation Report is an in-depth analysis detailing your home's value as well as a comparison with similar homes in the area
Home Values in the Area
Average Home Value in this Area
Purchase History
| Date | Buyer | Sale Price | Title Company |
|---|---|---|---|
| Leeburn Vincent | $289,500 | Stewart Title | |
| Huck Lansing S | $207,500 | Old Republic Title Company | |
| Britton James A | -- | -- |
Source: Public Records
Mortgage History
| Date | Status | Borrower | Loan Amount |
|---|---|---|---|
| Open | Leeburn Vincent | $260,550 | |
| Previous Owner | Huck Lansing S | $186,750 |
Source: Public Records
Tax History Compared to Growth
Tax History
| Year | Tax Paid | Tax Assessment Tax Assessment Total Assessment is a certain percentage of the fair market value that is determined by local assessors to be the total taxable value of land and additions on the property. | Land | Improvement |
|---|---|---|---|---|
| 2025 | $5,119 | $444,932 | $244,672 | $200,260 |
| 2024 | $5,119 | $436,209 | $239,875 | $196,334 |
| 2023 | $5,039 | $427,657 | $235,172 | $192,485 |
| 2022 | $5,000 | $419,272 | $230,561 | $188,711 |
| 2021 | $4,920 | $411,052 | $226,041 | $185,011 |
| 2020 | $4,846 | $406,838 | $223,724 | $183,114 |
| 2019 | $4,742 | $398,862 | $219,338 | $179,524 |
| 2018 | $4,728 | $391,042 | $215,038 | $176,004 |
| 2017 | $4,691 | $383,375 | $210,822 | $172,553 |
| 2016 | $4,569 | $375,859 | $206,689 | $169,170 |
| 2015 | $4,541 | $370,214 | $203,585 | $166,629 |
| 2014 | $4,483 | $362,963 | $199,598 | $163,365 |
Source: Public Records
Map
Nearby Homes
- 20394 Almaden Rd
- 21177 Almaden Rd
- 21292 Bertram Rd
- 20585 Whispering Oaks Dr
- 21400 Tierra Grande Ct
- 7565 Tierra Sombra Ct
- 21951 Shillingsburg Ave
- 765 Finchwood Way
- 1128 Foxhurst Way
- 7790 Lost View Rd
- 1020 Skybo Ct
- 22575 Country View Dr
- 20560 Henwood Rd
- 993 Woodview Place
- 21287 Almaden Rd
- 7003 Hollow Lake Way
- 7025 Bret Harte Dr
- 22629 Country View Dr
- 22649 Country View Ct
- 1140 Mallard Ridge Loop
- 20751 Almaden Rd
- 20801 Almaden Rd
- 20715 Mountain Dr
- 20810 Almaden Rd
- 20830 Almaden Rd
- 20701 Almaden Rd
- 20700 Almaden Rd
- 20691 Almaden Rd
- 20850 Almaden Rd
- 20799 Mountain Dr
- 20681 Almaden Rd
- 20671 Almaden Rd
- 20876 Almaden Rd
- 20861 Almaden Rd
- 20651 Almaden Rd
- 20655 Almaden Rd
- 20677 Rome Dr
- 20891 Almaden Rd
- 20777 Mountain Dr
- 20645 Almaden Rd