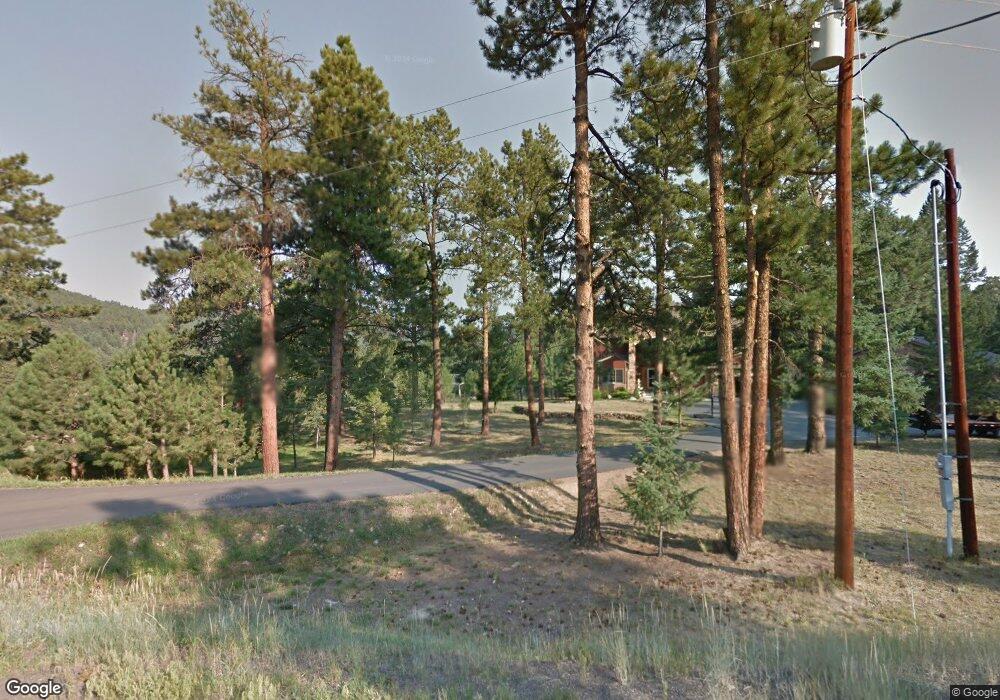
20745 Wagon Tongue Way Morrison, CO 80465
Homestead NeighborhoodEstimated Value: $1,311,856 - $1,523,000
4
Beds
7
Baths
3,686
Sq Ft
$393/Sq Ft
Est. Value
About This Home
This home is located at 20745 Wagon Tongue Way, Morrison, CO 80465 and is currently estimated at $1,446,964, approximately $392 per square foot. 20745 Wagon Tongue Way is a home located in Jefferson County with nearby schools including Parmalee Elementary School, West Jefferson Middle School, and Conifer Senior High School.
Ownership History
Date
Name
Owned For
Owner Type
Purchase Details
Closed on
Aug 31, 2005
Sold by
Old Republic National Title Insurance Co
Bought by
Vanni Carrie S and Vanni Tim E
Current Estimated Value
Home Financials for this Owner
Home Financials are based on the most recent Mortgage that was taken out on this home.
Original Mortgage
$450,000
Outstanding Balance
$239,691
Interest Rate
5.78%
Mortgage Type
Fannie Mae Freddie Mac
Estimated Equity
$1,207,273
Purchase Details
Closed on
Jul 2, 2002
Sold by
Murrow Remodeling & Construction Inc
Bought by
Nisky Michael F and Nisky Lisa T
Home Financials for this Owner
Home Financials are based on the most recent Mortgage that was taken out on this home.
Original Mortgage
$560,000
Interest Rate
5.25%
Purchase Details
Closed on
Oct 23, 2000
Sold by
Buffalo Park Development Company
Bought by
Murrow Remodeling & Construction Inc
Create a Home Valuation Report for This Property
The Home Valuation Report is an in-depth analysis detailing your home's value as well as a comparison with similar homes in the area
Home Values in the Area
Average Home Value in this Area
Purchase History
| Date | Buyer | Sale Price | Title Company |
|---|---|---|---|
| Vanni Carrie S | $680,000 | Land Title | |
| Old Republic National Title Insurance Co | $680,000 | Land Title | |
| Nisky Michael F | $700,000 | -- | |
| Murrow Remodeling & Construction Inc | $125,000 | -- |
Source: Public Records
Mortgage History
| Date | Status | Borrower | Loan Amount |
|---|---|---|---|
| Open | Vanni Carrie S | $450,000 | |
| Previous Owner | Nisky Michael F | $560,000 |
Source: Public Records
Tax History Compared to Growth
Tax History
| Year | Tax Paid | Tax Assessment Tax Assessment Total Assessment is a certain percentage of the fair market value that is determined by local assessors to be the total taxable value of land and additions on the property. | Land | Improvement |
|---|---|---|---|---|
| 2024 | $6,895 | $77,829 | $15,957 | $61,872 |
| 2023 | $6,895 | $77,829 | $15,957 | $61,872 |
| 2022 | $5,513 | $61,341 | $8,352 | $52,989 |
| 2021 | $5,558 | $63,105 | $8,592 | $54,513 |
| 2020 | $5,036 | $57,329 | $6,693 | $50,636 |
| 2019 | $4,962 | $57,329 | $6,693 | $50,636 |
| 2018 | $4,784 | $53,423 | $6,799 | $46,624 |
| 2017 | $4,197 | $53,423 | $6,799 | $46,624 |
| 2016 | $4,892 | $58,133 | $6,592 | $51,541 |
| 2015 | $4,327 | $58,133 | $6,592 | $51,541 |
| 2014 | $4,327 | $48,181 | $5,555 | $42,626 |
Source: Public Records
Map
Nearby Homes
- 8036 Settlers Dr
- 8066 Federation Dr
- 8090 S Homesteader Dr
- 8045 S Wagon Wheel Rd
- 8191 S Homesteader Dr
- 8422 S Ault Ln
- 7790 S Homesteader Dr
- 8386 S Davco Dr
- 8537 S Davco Dr
- 8752 S Ault Ln
- 19337 Hill Dr
- 8722 S Ault Ln
- 8537 S Doubleheader Ranch Rd
- 7948 S Turkey Creek Rd
- 7559 S Turkey Creek Rd
- 8838 Hillview Rd
- 8297 S Deer Creek Canyon Rd
- 8650 S Fairall Rd
- 8939 Hillview Rd
- 18844 Ute Vista Trail
- 20906 Horse Bit Way
- 20785 Wagon Tongue Way
- 20956 Horse Bit Way
- 8089 Iowa Gulch Rd
- 8139 Iowa Gulch Rd
- 21017 Horse Bit Way
- 0 Iowa Gulch Rd
- 4 Iowa Gulch Rd
- 1 Iowa Gulch Rd
- TBD4 Iowa Gulch Rd
- TBD1 Iowa Gulch Rd
- TBD 4 Iowa Gulch Rd
- Lot 1 Iowa Gulch Rd
- 20907 Horse Bit Way
- 7993 Surrey Dr
- 7909 Iowa Gulch Rd
- 8053 Surrey Dr
- 8175 Federation Dr
- 8037 S Settlers Dr
- 8216 Federation Dr