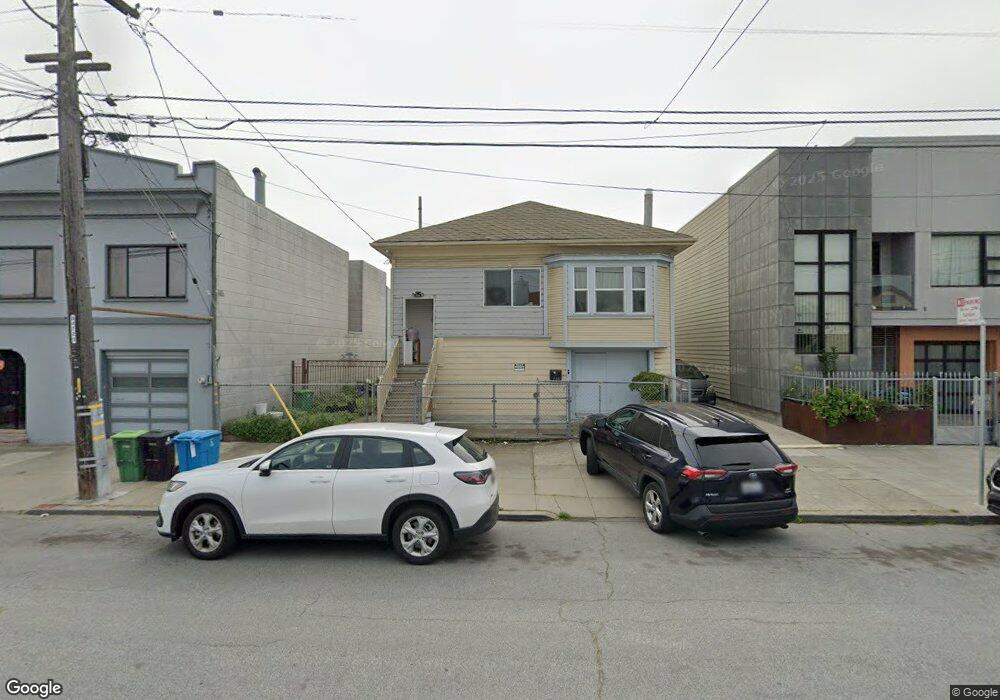
2075 Bancroft Ave San Francisco, CA 94124
Silver Terrace NeighborhoodEstimated Value: $691,000 - $857,000
2
Beds
1
Bath
560
Sq Ft
$1,394/Sq Ft
Est. Value
About This Home
This home is located at 2075 Bancroft Ave, San Francisco, CA 94124 and is currently estimated at $780,908, approximately $1,394 per square foot. 2075 Bancroft Ave is a home located in San Francisco County with nearby schools including Dr. Charles R. Drew College Preparatory Academy, Willie L. Brown Jr. Middle School, and Alta Vista School.
Ownership History
Date
Name
Owned For
Owner Type
Purchase Details
Closed on
Dec 9, 2016
Sold by
Liang Rong Pan and Liang Shui Ying
Bought by
Nguyen Ha V
Current Estimated Value
Home Financials for this Owner
Home Financials are based on the most recent Mortgage that was taken out on this home.
Original Mortgage
$325,000
Outstanding Balance
$265,777
Interest Rate
3.94%
Mortgage Type
New Conventional
Estimated Equity
$515,131
Purchase Details
Closed on
May 1, 2013
Sold by
Mosher Robert H and Bond Barbara A
Bought by
Liang Rond Pan and Liang Shui Ying
Purchase Details
Closed on
Feb 22, 2008
Sold by
Bond Barbara A
Bought by
Mosher Robert H
Purchase Details
Closed on
Feb 15, 2008
Sold by
Mosher Robert H
Bought by
Mosher Robert H and Bond Barbara A
Purchase Details
Closed on
May 21, 1996
Sold by
Mosher Elenore H and Mosher Elenore Haertel
Bought by
Mosher Elenore Haertel
Create a Home Valuation Report for This Property
The Home Valuation Report is an in-depth analysis detailing your home's value as well as a comparison with similar homes in the area
Home Values in the Area
Average Home Value in this Area
Purchase History
| Date | Buyer | Sale Price | Title Company |
|---|---|---|---|
| Nguyen Ha V | $900,000 | Old Republic Title Company | |
| Nguyen Ha V | -- | Old Republic Title Company | |
| Liang Rond Pan | $650,000 | Fidelity National Title Co | |
| Mosher Robert H | -- | Fidelity National Title Co | |
| Mosher Robert H | -- | None Available | |
| Mosher Elenore Haertel | -- | -- |
Source: Public Records
Mortgage History
| Date | Status | Borrower | Loan Amount |
|---|---|---|---|
| Open | Nguyen Ha V | $325,000 |
Source: Public Records
Tax History Compared to Growth
Tax History
| Year | Tax Paid | Tax Assessment Tax Assessment Total Assessment is a certain percentage of the fair market value that is determined by local assessors to be the total taxable value of land and additions on the property. | Land | Improvement |
|---|---|---|---|---|
| 2025 | $6,894 | $522,257 | $365,581 | $156,676 |
| 2024 | $6,894 | $512,017 | $358,413 | $153,604 |
| 2023 | $6,738 | $501,979 | $351,386 | $150,593 |
| 2022 | $6,591 | $492,138 | $344,497 | $147,641 |
| 2021 | $6,471 | $482,490 | $337,743 | $144,747 |
| 2020 | $6,565 | $477,543 | $334,280 | $143,263 |
| 2019 | $6,297 | $468,180 | $327,726 | $140,454 |
| 2018 | $6,089 | $459,000 | $321,300 | $137,700 |
| 2017 | $4,486 | $344,834 | $241,385 | $103,449 |
| 2016 | $4,391 | $338,073 | $236,652 | $101,421 |
| 2015 | $629 | $19,584 | $19,584 | $0 |
| 2014 | $616 | $19,201 | $19,201 | $0 |
Source: Public Records
Map
Nearby Homes
- 555 Thornton Ave
- 1830 Egbert Ave
- 901 Bayshore Blvd Unit 311
- 153 Silliman St
- 324 Topeka Ave
- 77 Reddy St
- 406 Goettingen St
- 2931 San Bruno Ave
- 215 Thornton Ave
- 200 Bayview Cir
- 548 Burrows St
- 3101 San Bruno Ave
- 2626 San Bruno Ave
- 1740 Bancroft Ave Unit 4504
- 130 Bridgeview Dr
- 535 Felton St
- 1698 Armstrong Ave
- 107 Dwight St
- 5264 3rd St Unit 303
- 5800 3rd St Unit 1102
- 2075 Bancroft Ave
- 2077 Bancroft Ave
- 2067 Bancroft Ave
- 2083 Bancroft Ave
- 2063 Bancroft Ave
- 2091 Bancroft Ave
- 2059 Bancroft Ave
- 2076 Carroll Ave
- 2070 Carroll Ave
- 2080 Carroll Ave
- 2093 Bancroft Ave
- 2066 Carroll Ave
- 2084 Carroll Ave
- 2055 Bancroft Ave
- 2062 Carroll Ave
- 2088 Carroll Ave
- 2095 Bancroft Ave
- 2058 Carroll Ave
- 2092 Carroll Ave
- 2051 Bancroft Ave