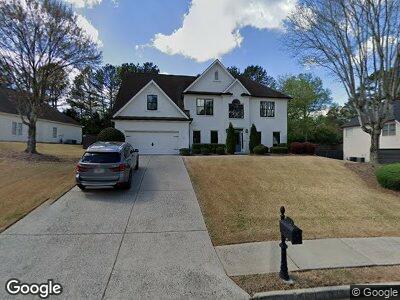
2075 North Bethany Creek Dr Alpharetta, GA 30004
Estimated Value: $638,227 - $736,000
4
Beds
3
Baths
2,532
Sq Ft
$273/Sq Ft
Est. Value
About This Home
This home is located at 2075 North Bethany Creek Dr, Alpharetta, GA 30004 and is currently estimated at $690,807, approximately $272 per square foot. 2075 North Bethany Creek Dr is a home located in Fulton County with nearby schools including Cogburn Woods Elementary School, Hopewell Middle School, and Cambridge High School.
Ownership History
Date
Name
Owned For
Owner Type
Purchase Details
Closed on
Jun 25, 2004
Sold by
Cendant Mobiltity Financial Svc
Bought by
Tovar Abel
Current Estimated Value
Home Financials for this Owner
Home Financials are based on the most recent Mortgage that was taken out on this home.
Original Mortgage
$52,800
Interest Rate
6.25%
Mortgage Type
New Conventional
Purchase Details
Closed on
Jul 26, 2000
Sold by
Yarbrough Gary A
Bought by
Mango Jeffrey J and Mango Kathleen G
Home Financials for this Owner
Home Financials are based on the most recent Mortgage that was taken out on this home.
Original Mortgage
$159,800
Interest Rate
8.23%
Mortgage Type
New Conventional
Purchase Details
Closed on
Sep 25, 1998
Sold by
Morrison Homes Of Florida Inc
Bought by
Yarbrough Gary A
Home Financials for this Owner
Home Financials are based on the most recent Mortgage that was taken out on this home.
Original Mortgage
$163,294
Interest Rate
6.96%
Mortgage Type
New Conventional
Create a Home Valuation Report for This Property
The Home Valuation Report is an in-depth analysis detailing your home's value as well as a comparison with similar homes in the area
Home Values in the Area
Average Home Value in this Area
Purchase History
| Date | Buyer | Sale Price | Title Company |
|---|---|---|---|
| Tovar Abel | $264,000 | -- | |
| Cendant Mobility Financial Svc | $144,800 | -- | |
| Mango Jeffrey J | $230,000 | -- | |
| Yarbrough Gary A | $204,200 | -- |
Source: Public Records
Mortgage History
| Date | Status | Borrower | Loan Amount |
|---|---|---|---|
| Open | Tovar Abel | $181,000 | |
| Closed | Tovar Abel | $196,600 | |
| Closed | Cendant Mobility Financial Svc | $52,800 | |
| Closed | Cendant Mobility Financial Svc | $211,200 | |
| Previous Owner | Mango Jeffrey J | $155,100 | |
| Previous Owner | Mango Jeffrey J | $159,800 | |
| Previous Owner | Yarbrough Gary A | $163,294 |
Source: Public Records
Tax History Compared to Growth
Tax History
| Year | Tax Paid | Tax Assessment Tax Assessment Total Assessment is a certain percentage of the fair market value that is determined by local assessors to be the total taxable value of land and additions on the property. | Land | Improvement |
|---|---|---|---|---|
| 2023 | $4,639 | $164,360 | $41,560 | $122,800 |
| 2022 | $2,956 | $164,360 | $41,560 | $122,800 |
| 2021 | $2,947 | $159,520 | $40,320 | $119,200 |
| 2020 | $2,974 | $157,640 | $39,840 | $117,800 |
| 2019 | $560 | $154,880 | $39,160 | $115,720 |
| 2018 | $3,586 | $151,240 | $38,240 | $113,000 |
| 2017 | $2,848 | $109,560 | $24,000 | $85,560 |
| 2016 | $2,818 | $109,560 | $24,000 | $85,560 |
| 2015 | $3,276 | $109,560 | $24,000 | $85,560 |
| 2014 | $2,367 | $109,560 | $24,000 | $85,560 |
Source: Public Records
Map
Nearby Homes
- 1095 S Bethany Creek Dr
- 315 Aurelia Trace
- 205 Lembeth Ct
- 3350 Serenade Ct
- 13943 Sunfish Bend
- 3692 Archgate Ct
- 2927 Oakside Cir
- 13400 Avensong Crossing
- 222 Harmony Ct
- 195 Galecrest Dr
- 1145 Ledmark Ct
- 3380 Galleon Dr
- 575 Gale Ct
- 3382 Galleon Dr
- 3077 Oakside Cir
- 215 Harmony Ct
- 860 Hargrove Point Way
- 14143 Yacht Terrace
- 2075 North Bethany Creek Dr
- 2065 N Bethany Creek Dr
- 2065 North Bethany Creek Dr
- 2085 North Bethany Creek Dr
- 550 Parkbrook Trace
- 2090 N Bethany Creek Dr
- 2090 North Bethany Creek Dr
- 2055 North Bethany Creek Dr
- 2100 North Bethany Creek Dr
- 2080 North Bethany Creek Dr
- 2080 N Bethany Creek Dr
- 2110 N Bethany Creek Dr
- 2110 North Bethany Creek Dr
- 560 Parkbrook Trace
- 2045 N Bethany Creek Dr Unit 5
- 2045 N Bethany Creek Dr
- 1160 South Bethany Creek Dr
- 2045 North Bethany Creek Dr
- 1160 S Bethany Creek Dr
- 2095 North Bethany Creek Dr