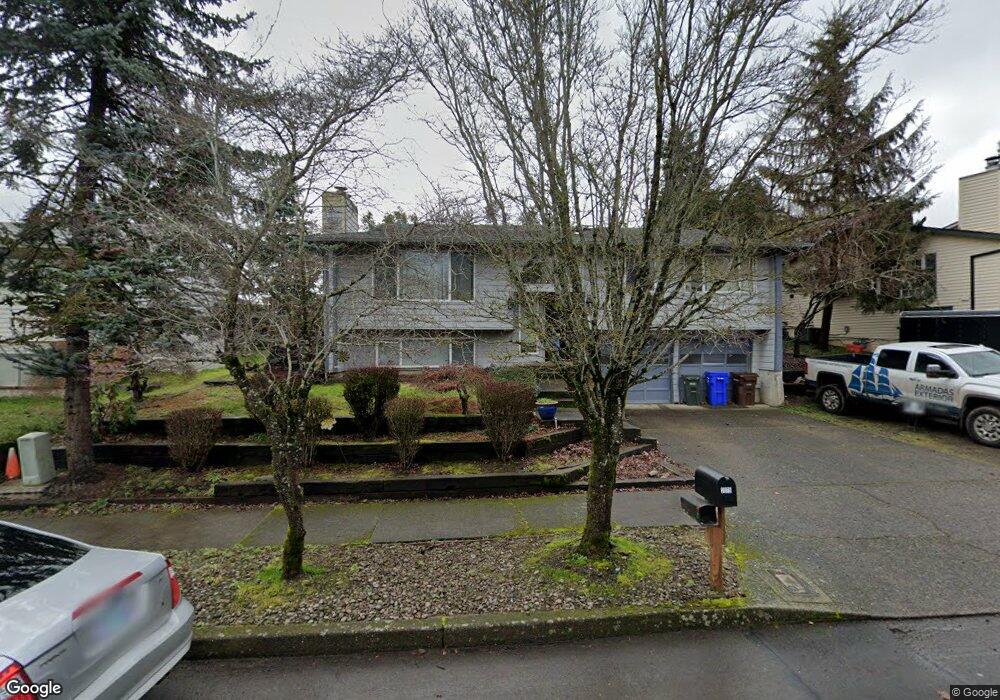
2075 NW 14th St Gresham, OR 97030
Northwest Gresham NeighborhoodEstimated Value: $486,000 - $555,000
3
Beds
3
Baths
1,668
Sq Ft
$314/Sq Ft
Est. Value
About This Home
This home is located at 2075 NW 14th St, Gresham, OR 97030 and is currently estimated at $524,238, approximately $314 per square foot. 2075 NW 14th St is a home located in Multnomah County with nearby schools including North Gresham Elementary School, Clear Creek Middle School, and Gresham High School.
Ownership History
Date
Name
Owned For
Owner Type
Purchase Details
Closed on
Oct 11, 2017
Sold by
Boynton Sandra E
Bought by
Anderson Lloyd and Anderson Desirae
Current Estimated Value
Home Financials for this Owner
Home Financials are based on the most recent Mortgage that was taken out on this home.
Original Mortgage
$319,113
Outstanding Balance
$265,907
Interest Rate
3.82%
Mortgage Type
FHA
Estimated Equity
$258,331
Purchase Details
Closed on
Jan 16, 2008
Sold by
Schuller Mike
Bought by
Boynton Sandra E
Home Financials for this Owner
Home Financials are based on the most recent Mortgage that was taken out on this home.
Original Mortgage
$181,500
Interest Rate
6.09%
Mortgage Type
Purchase Money Mortgage
Purchase Details
Closed on
Jul 26, 1995
Sold by
Palomino David J
Bought by
Schuller Dianna M
Home Financials for this Owner
Home Financials are based on the most recent Mortgage that was taken out on this home.
Original Mortgage
$127,850
Interest Rate
7.62%
Mortgage Type
Purchase Money Mortgage
Create a Home Valuation Report for This Property
The Home Valuation Report is an in-depth analysis detailing your home's value as well as a comparison with similar homes in the area
Home Values in the Area
Average Home Value in this Area
Purchase History
| Date | Buyer | Sale Price | Title Company |
|---|---|---|---|
| Anderson Lloyd | $325,000 | Fidelity Natl Title Of Or | |
| Boynton Sandra E | $242,000 | Fidelity Natl Title Co Of Or | |
| Schuller Dianna M | $134,600 | First American Title Ins Co |
Source: Public Records
Mortgage History
| Date | Status | Borrower | Loan Amount |
|---|---|---|---|
| Open | Anderson Lloyd | $319,113 | |
| Previous Owner | Boynton Sandra E | $181,500 | |
| Previous Owner | Schuller Dianna M | $127,850 |
Source: Public Records
Tax History
| Year | Tax Paid | Tax Assessment Tax Assessment Total Assessment is a certain percentage of the fair market value that is determined by local assessors to be the total taxable value of land and additions on the property. | Land | Improvement |
|---|---|---|---|---|
| 2025 | $6,372 | $313,140 | -- | -- |
| 2024 | $6,100 | $304,020 | -- | -- |
| 2023 | $6,100 | $295,170 | -- | -- |
| 2022 | $5,402 | $286,580 | $0 | $0 |
| 2021 | $5,266 | $278,240 | $0 | $0 |
| 2020 | $4,955 | $270,140 | $0 | $0 |
| 2019 | $4,825 | $262,280 | $0 | $0 |
| 2018 | $4,601 | $254,650 | $0 | $0 |
| 2017 | $4,414 | $247,240 | $0 | $0 |
| 2016 | $3,892 | $240,040 | $0 | $0 |
| 2015 | $3,808 | $233,050 | $0 | $0 |
| 2014 | $3,715 | $226,270 | $0 | $0 |
Source: Public Records
Map
Nearby Homes
- 1387 NW Riverview Ave Unit 14B
- 70 NW Birdsdale Ave
- 970 NW Wonderview Ct Unit 980
- 1861 NW Wonderview Ave
- 1811 NW 19th St
- 1745 NW 7th Place
- 765 NW Angeline Ave
- 2013 NW Bella Vista Dr
- 1325 NW 9th St
- 21033 SE Clay Ct
- 994 NW Wallula Ave
- 2095 NW 3rd St
- 284 NW Mawrcrest Ave
- 296 NW Mawrcrest Ave
- 256 NW Mawrcrest Ave
- 236 NW Mawrcrest Ave
- 230 NW Mawrcrest Ave
- 1026 SE 209th Ave
- 185 NW Mawrcrest Ave
- 181 NW Mawrcrest Ave
- 2055 NW 14th St
- 2062 NW 15th Ct
- 2105 NW 14th St
- 2082 NW 15th Ct
- 1380 NW Riverview Ave
- 2035 NW 14th St
- 2042 NW 15th Ct
- 2115 NW 14th St
- 2112 NW 15th Ct
- 2110 NW 14th $4000 Closing
- 2110 NW 14th St Unit 11A
- 2112 NW 14th St
- 1994 NW 14th St
- 2132 NW 15th Ct
- 2135 NW 14th St
- 1320 NW Riverview Ave
- 2120 NW 14th St Unit 9A
- 1545 NW Riverview Ave
- 1385 NW Riverview Ave Unit 13A
- 2122 NW 14th St Unit 10B
Your Personal Tour Guide
Ask me questions while you tour the home.