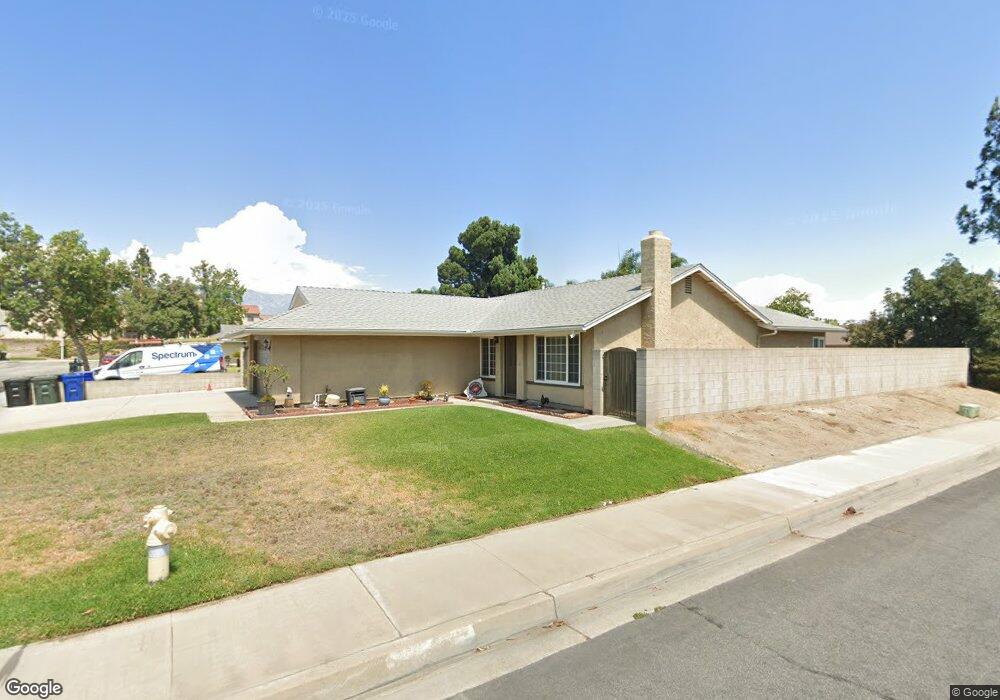
2075 S Taylor Place Ontario, CA 91761
Downtown Ontario NeighborhoodEstimated Value: $686,000 - $741,000
3
Beds
2
Baths
1,450
Sq Ft
$485/Sq Ft
Est. Value
About This Home
This home is located at 2075 S Taylor Place, Ontario, CA 91761 and is currently estimated at $703,909, approximately $485 per square foot. 2075 S Taylor Place is a home located in San Bernardino County with nearby schools including Bon View Elementary, De Anza Middle, and Ontario High School.
Ownership History
Date
Name
Owned For
Owner Type
Purchase Details
Closed on
Jun 15, 2018
Sold by
Goltz Robert W and Goltz Veronica
Bought by
Goltz Robert W and Goltz Veronica
Current Estimated Value
Purchase Details
Closed on
Nov 30, 2017
Sold by
Goltz Robert and Goltz Veronica
Bought by
Goltz Robert and Goltz Veronica
Home Financials for this Owner
Home Financials are based on the most recent Mortgage that was taken out on this home.
Original Mortgage
$307,834
Outstanding Balance
$259,169
Interest Rate
3.94%
Mortgage Type
VA
Estimated Equity
$444,740
Purchase Details
Closed on
Apr 18, 2002
Sold by
Saldivar Mike and Saldivar Rosie
Bought by
Goltz Robert W and Goltz Veronica
Home Financials for this Owner
Home Financials are based on the most recent Mortgage that was taken out on this home.
Original Mortgage
$226,600
Interest Rate
6.89%
Mortgage Type
VA
Purchase Details
Closed on
Dec 2, 1997
Sold by
Saldivar Rosie I
Bought by
Saldivar Mike
Create a Home Valuation Report for This Property
The Home Valuation Report is an in-depth analysis detailing your home's value as well as a comparison with similar homes in the area
Home Values in the Area
Average Home Value in this Area
Purchase History
| Date | Buyer | Sale Price | Title Company |
|---|---|---|---|
| Goltz Robert W | -- | None Available | |
| Goltz Robert | -- | First American Title Sd | |
| Goltz Robert W | $220,000 | Orange Coast Title | |
| Saldivar Mike | -- | Universal Title Company |
Source: Public Records
Mortgage History
| Date | Status | Borrower | Loan Amount |
|---|---|---|---|
| Open | Goltz Robert | $307,834 | |
| Closed | Goltz Robert W | $226,600 |
Source: Public Records
Tax History Compared to Growth
Tax History
| Year | Tax Paid | Tax Assessment Tax Assessment Total Assessment is a certain percentage of the fair market value that is determined by local assessors to be the total taxable value of land and additions on the property. | Land | Improvement |
|---|---|---|---|---|
| 2025 | $3,465 | $325,007 | $113,751 | $211,256 |
| 2024 | $3,465 | $318,635 | $111,521 | $207,114 |
| 2023 | $3,367 | $312,387 | $109,334 | $203,053 |
| 2022 | $3,322 | $306,262 | $107,190 | $199,072 |
| 2021 | $3,300 | $300,257 | $105,088 | $195,169 |
| 2020 | $3,242 | $297,178 | $104,010 | $193,168 |
| 2019 | $3,213 | $291,351 | $101,971 | $189,380 |
| 2018 | $3,168 | $285,639 | $99,972 | $185,667 |
| 2017 | $3,055 | $280,038 | $98,012 | $182,026 |
| 2016 | $2,934 | $274,547 | $96,090 | $178,457 |
| 2015 | $2,914 | $270,423 | $94,647 | $175,776 |
| 2014 | $2,823 | $265,126 | $92,793 | $172,333 |
Source: Public Records
Map
Nearby Homes
- 2119 S Phoenix Place
- 2030 S Bon View Ave Unit G
- 840 E Cedar St
- 2001 S Campus Ave Unit 7F
- 4235 S Gasly Paseo
- 0 Vineyard Unit CV25067044
- 4245 S Grasly Paseo
- 4233 S Grasly Paseo
- 0 Phillips Unit CV23180894
- 2408 S Taylor Place
- 2148 S Sultana Ave
- 2437 S Garfield Place
- 2300 S Sultana Ave Unit 298
- 513 E Fairfield Ct
- 310 E Philadelphia St Unit 35
- 310 E Philadelphia St
- 304 E Cedar St
- 2453 S Marigold Place
- 1650 S Campus Ave Unit 21
- 1650 S Campus Ave Unit 20
- 2071 S Taylor Place
- 2074 S Hope Place
- 2065 S Taylor Place
- 2070 S Hope Place
- 828 E Spruce St
- 2064 S Hope Place
- 2074 S Taylor Place
- 2059 S Taylor Place
- 2070 S Taylor Place
- 2106 S Taylor Place
- 840 E Spruce St
- 2060 S Hope Place
- 2112 S Taylor Place
- 2053 S Taylor Place
- 846 E Spruce St
- 2060 S Taylor Place
- 2120 S Taylor Place
- 2054 S Hope Place
- 2105 Caldwell Place
- 2109 Caldwell Place