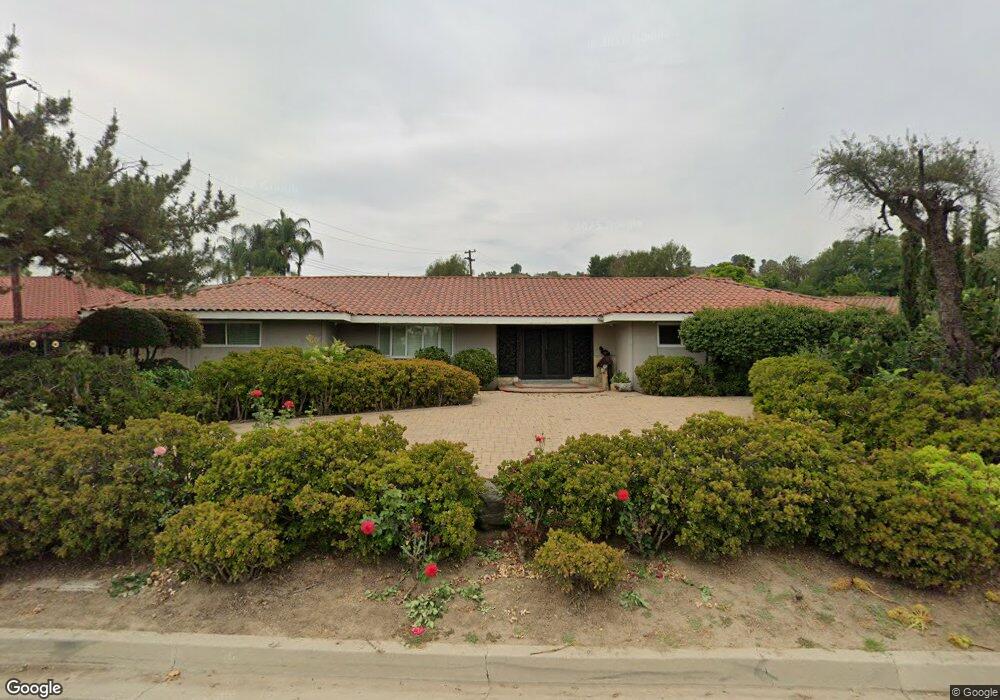
20753 Fuerte Dr Walnut, CA 91789
Estimated Value: $1,635,400 - $2,570,000
6
Beds
4
Baths
3,301
Sq Ft
$597/Sq Ft
Est. Value
About This Home
This home is located at 20753 Fuerte Dr, Walnut, CA 91789 and is currently estimated at $1,969,350, approximately $596 per square foot. 20753 Fuerte Dr is a home located in Los Angeles County with nearby schools including Vejar Elementary School, Suzanne Middle School, and Walnut High School.
Ownership History
Date
Name
Owned For
Owner Type
Purchase Details
Closed on
Nov 16, 2022
Sold by
Chow Susan Wai-Sen Pien
Bought by
Chow Susan Wai-Sen Pien and Chow Charles Lewis
Current Estimated Value
Purchase Details
Closed on
Jun 28, 2017
Sold by
Chow John Ding Chung
Bought by
Chow Susan Wai Sen Pien
Purchase Details
Closed on
Jul 29, 2016
Sold by
Chow John Ding Chung and Chow Susan Wei Sen Pien
Bought by
Chow Susan Wai Sen Pien
Purchase Details
Closed on
Apr 29, 2003
Sold by
Chow Jean Gin Yi
Bought by
Chow John Ding Chung and Chow Susan Wei Sen Pien
Purchase Details
Closed on
Jun 28, 1999
Sold by
Marshall Steven B and Bradac Pamela F
Bought by
Chow Jean Gin Yi
Home Financials for this Owner
Home Financials are based on the most recent Mortgage that was taken out on this home.
Original Mortgage
$196,000
Interest Rate
7.24%
Create a Home Valuation Report for This Property
The Home Valuation Report is an in-depth analysis detailing your home's value as well as a comparison with similar homes in the area
Home Values in the Area
Average Home Value in this Area
Purchase History
| Date | Buyer | Sale Price | Title Company |
|---|---|---|---|
| Chow Susan Wai-Sen Pien | -- | Accommodation/Courtesy Recordi | |
| Chow Susan Wai Sen Pien | -- | None Available | |
| Chow Susan Wai Sen Pien | -- | None Available | |
| Chow John Ding Chung | -- | -- | |
| Chow Jean Gin Yi | $346,000 | Stewart Title |
Source: Public Records
Mortgage History
| Date | Status | Borrower | Loan Amount |
|---|---|---|---|
| Previous Owner | Chow Jean Gin Yi | $196,000 |
Source: Public Records
Tax History Compared to Growth
Tax History
| Year | Tax Paid | Tax Assessment Tax Assessment Total Assessment is a certain percentage of the fair market value that is determined by local assessors to be the total taxable value of land and additions on the property. | Land | Improvement |
|---|---|---|---|---|
| 2025 | $10,358 | $838,987 | $332,284 | $506,703 |
| 2024 | $10,358 | $822,537 | $325,769 | $496,768 |
| 2023 | $7,365 | $573,646 | $319,382 | $254,264 |
| 2022 | $7,216 | $562,399 | $313,120 | $249,279 |
| 2021 | $7,078 | $551,373 | $306,981 | $244,392 |
| 2019 | $6,861 | $535,022 | $297,877 | $237,145 |
| 2018 | $5,771 | $467,362 | $292,037 | $175,325 |
| 2016 | $5,349 | $449,216 | $280,698 | $168,518 |
| 2015 | $5,379 | $442,469 | $276,482 | $165,987 |
| 2014 | $5,396 | $433,803 | $271,067 | $162,736 |
Source: Public Records
Map
Nearby Homes
- 0 Gartel Dr
- 20487 Gartel Dr
- 931 Sky Meadow Place
- 833 Silver Valley Trail
- 421 Wrangler Way
- 20982 Divonne Dr
- 302 Spur Trail Ave
- 1330 Waterbrook Cir
- 20824 Fuero Dr
- 673 Bronco Way
- 1202 Duke Ln
- 21630 Acanthus Cir
- 22046 Florence Cir
- 22013 Florence Cir
- 221 Roma Ct
- 226 Roma Ct
- 180 Ricci Ave
- 22049 Portofino Dr
- 19873 Calle Granada
- 20532 Varsity Dr
- 20741 Fuerte Dr
- 20757 Fuerte Dr
- 20731 Fuerte Dr
- 20720 Bridle Trail Ln
- 20823 Fuerte Dr
- 20725 Fuerte Dr
- 20816 Fuerte Dr
- 20726 Bridle Trail Ln
- 726 Bridle Trail Rd
- 656 Suzanne Rd
- 20833 Fuerte Dr
- 638 Suzanne Rd
- 20843 Fuerte Dr
- 705 Bridle Trail Rd
- 711 Bridle Trail Rd
- 20727 Bridle Trail Ln
- 719 Bridle Trail Rd
- 20715 Bridle Trail Ln
- 20828 Fuerte Dr
- 665 Gartel Dr