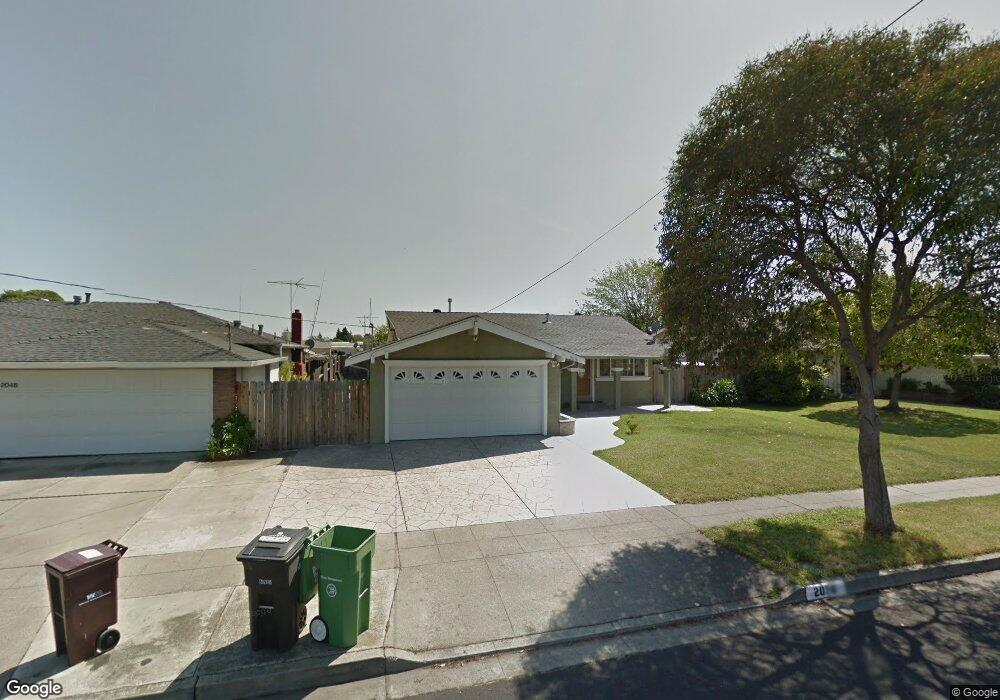
2076 Catalpa Way Hayward, CA 94545
Glen Eden NeighborhoodEstimated Value: $788,000 - $876,810
3
Beds
2
Baths
1,064
Sq Ft
$794/Sq Ft
Est. Value
About This Home
This home is located at 2076 Catalpa Way, Hayward, CA 94545 and is currently estimated at $844,453, approximately $793 per square foot. 2076 Catalpa Way is a home located in Alameda County with nearby schools including Palma Ceia Elementary School, Anthony W. Ochoa Middle School, and Mt. Eden High School.
Ownership History
Date
Name
Owned For
Owner Type
Purchase Details
Closed on
Aug 4, 2017
Sold by
Paz Luis Antonio Soto and Dinh Hoangyen
Bought by
Paz Luis Antonio Soto and Dinh Hoangyen
Current Estimated Value
Home Financials for this Owner
Home Financials are based on the most recent Mortgage that was taken out on this home.
Original Mortgage
$100,000
Outstanding Balance
$85,653
Interest Rate
4.99%
Mortgage Type
Adjustable Rate Mortgage/ARM
Estimated Equity
$758,800
Purchase Details
Closed on
Jul 25, 2017
Sold by
Zazarte Jose
Bought by
Dezazarte Margarita Paz
Home Financials for this Owner
Home Financials are based on the most recent Mortgage that was taken out on this home.
Original Mortgage
$100,000
Outstanding Balance
$85,653
Interest Rate
4.99%
Mortgage Type
Adjustable Rate Mortgage/ARM
Estimated Equity
$758,800
Purchase Details
Closed on
Nov 26, 2015
Sold by
Dezarate Margarita Paz
Bought by
Soto Luis Antonio and Dinh Hoangyen
Purchase Details
Closed on
Aug 7, 2013
Sold by
U S Catering Truck Manufacturing Llc
Bought by
Dezarate Margarita Paz
Purchase Details
Closed on
Jul 26, 2012
Sold by
U S Bank National Association
Bought by
U S Catering Truck Manufacturing Llc
Purchase Details
Closed on
Dec 1, 2011
Sold by
Castillo Roger A and Carazo Margarita M
Bought by
U S Bank National Association and Bank Of America National Association
Purchase Details
Closed on
Jun 24, 2004
Sold by
Tran Canli M and Nguyen Huylan
Bought by
Castillo Roger A and Carazo Margarita M
Home Financials for this Owner
Home Financials are based on the most recent Mortgage that was taken out on this home.
Original Mortgage
$340,000
Interest Rate
5.62%
Mortgage Type
Purchase Money Mortgage
Purchase Details
Closed on
Mar 22, 2004
Sold by
Tran Canh M
Bought by
Tran Canh M and Nguyen Huylan
Home Financials for this Owner
Home Financials are based on the most recent Mortgage that was taken out on this home.
Original Mortgage
$248,000
Interest Rate
5.64%
Mortgage Type
New Conventional
Purchase Details
Closed on
May 17, 2002
Sold by
Nguyen Sang T
Bought by
Tran Dinh D
Home Financials for this Owner
Home Financials are based on the most recent Mortgage that was taken out on this home.
Original Mortgage
$104,000
Interest Rate
6.89%
Purchase Details
Closed on
May 16, 2002
Sold by
Tran Dinh D and Tran Tuong V
Bought by
Tran Canh M
Home Financials for this Owner
Home Financials are based on the most recent Mortgage that was taken out on this home.
Original Mortgage
$104,000
Interest Rate
6.89%
Create a Home Valuation Report for This Property
The Home Valuation Report is an in-depth analysis detailing your home's value as well as a comparison with similar homes in the area
Home Values in the Area
Average Home Value in this Area
Purchase History
| Date | Buyer | Sale Price | Title Company |
|---|---|---|---|
| Paz Luis Antonio Soto | -- | Wfg National Title Ins Co | |
| Dezazarte Margarita Paz | -- | Wfg National Title Ins Co | |
| Soto Luis Antonio | -- | None Available | |
| Dezarate Margarita Paz | -- | None Available | |
| U S Catering Truck Manufacturing Llc | $302,000 | North American Title Co Inc | |
| U S Bank National Association | $212,874 | None Available | |
| Castillo Roger A | $425,000 | Alliance Title Company | |
| Tran Canh M | -- | Placer Title Co | |
| Tran Dinh D | -- | Commonwealth Land Title Co | |
| Tran Tuong V | -- | Commonwealth Land Title Co | |
| Tran Canh M | $160,000 | Commonwealth Land Title Co |
Source: Public Records
Mortgage History
| Date | Status | Borrower | Loan Amount |
|---|---|---|---|
| Open | Paz Luis Antonio Soto | $100,000 | |
| Previous Owner | Castillo Roger A | $340,000 | |
| Previous Owner | Tran Canh M | $248,000 | |
| Previous Owner | Tran Canh M | $104,000 | |
| Closed | Castillo Roger A | $85,000 |
Source: Public Records
Tax History Compared to Growth
Tax History
| Year | Tax Paid | Tax Assessment Tax Assessment Total Assessment is a certain percentage of the fair market value that is determined by local assessors to be the total taxable value of land and additions on the property. | Land | Improvement |
|---|---|---|---|---|
| 2025 | $5,540 | $429,033 | $128,710 | $300,323 |
| 2024 | $5,540 | $420,622 | $126,186 | $294,436 |
| 2023 | $5,280 | $412,376 | $123,713 | $288,663 |
| 2022 | $5,180 | $404,291 | $121,287 | $283,004 |
| 2021 | $5,138 | $396,367 | $118,910 | $277,457 |
| 2020 | $5,082 | $392,304 | $117,691 | $274,613 |
| 2019 | $5,123 | $384,614 | $115,384 | $269,230 |
| 2018 | $4,813 | $377,075 | $113,122 | $263,953 |
| 2017 | $4,704 | $369,683 | $110,905 | $258,778 |
| 2016 | $4,432 | $362,434 | $108,730 | $253,704 |
| 2015 | $4,345 | $356,992 | $107,097 | $249,895 |
| 2014 | $4,130 | $350,000 | $105,000 | $245,000 |
Source: Public Records
Map
Nearby Homes
- 1925 Lilac Ave
- 28290 Applegate St
- 2329 Bridwell Way
- 2187 Bourbon Dr
- 2072 Everglade St
- 2284 Bourbon Dr Unit 61
- 2168 Keys Place
- 1835 Egret Ln
- 27707 La Porte Ave
- 28147 Murcia St Unit 324
- 2380 Cabrillo Dr
- 27781 Mandarin Ave
- 27828 Mandarin Ave
- 28399 Cubberley Ct
- 1587 de Lemos Ave
- 1580 Balein Ct Unit 14
- 2553 Phelan Ave
- 1541 Ortega Ave Unit 39
- 27584 La Porte Ave
- 2421 Arf Ave
- 2094 Catalpa Way
- 2048 Catalpa Way
- 28216 Armour St
- 2030 Catalpa Way
- 2122 Catalpa Way
- 28232 Armour St
- 28200 Armour St
- 2077 Catalpa Way
- 2002 Catalpa Way
- 2099 Catalpa Way
- 2150 Catalpa Way
- 28209 Sparrow Rd
- 2045 Catalpa Way
- 2101 Catalpa Way
- 2151 Bridwell Way
- 28223 Armour St Unit 18
- 28223 Armour St
- 2023 Catalpa Way
- 2169 Bridwell Way
- 2169 Bridwell Way Unit 104