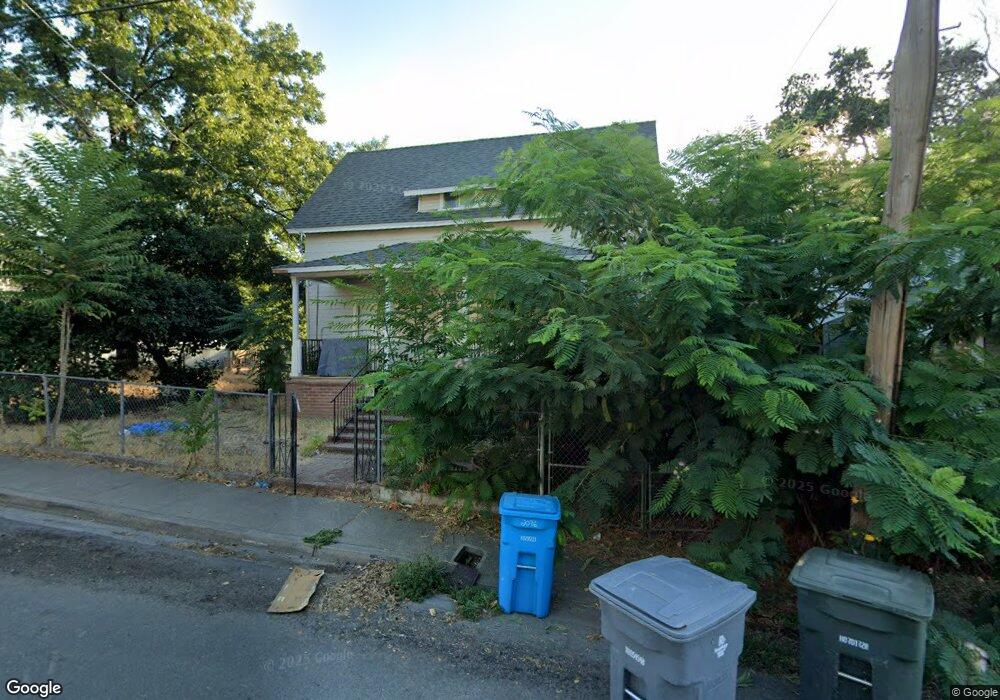
2076 Gray St Oroville, CA 95965
Estimated Value: $225,000 - $267,000
4
Beds
2
Baths
1,788
Sq Ft
$138/Sq Ft
Est. Value
About This Home
This home is located at 2076 Gray St, Oroville, CA 95965 and is currently estimated at $247,129, approximately $138 per square foot. 2076 Gray St is a home located in Butte County with nearby schools including Oroville High School, Ipakanni Early College Charter School, and Come Back Butte Charter School.
Ownership History
Date
Name
Owned For
Owner Type
Purchase Details
Closed on
Apr 11, 2022
Sold by
Dc Investments One Llc
Bought by
Dc Investments Three Llc
Current Estimated Value
Home Financials for this Owner
Home Financials are based on the most recent Mortgage that was taken out on this home.
Original Mortgage
$210,600
Outstanding Balance
$195,324
Interest Rate
3.76%
Mortgage Type
New Conventional
Estimated Equity
$51,805
Purchase Details
Closed on
Aug 17, 2021
Sold by
Richard Kepple Lloyd
Bought by
Walsh Jeanette
Home Financials for this Owner
Home Financials are based on the most recent Mortgage that was taken out on this home.
Original Mortgage
$108,000
Interest Rate
2.9%
Mortgage Type
Commercial
Purchase Details
Closed on
Aug 10, 2021
Sold by
Walsh Jeanette
Bought by
Dc Investments One Llc
Home Financials for this Owner
Home Financials are based on the most recent Mortgage that was taken out on this home.
Original Mortgage
$108,000
Interest Rate
2.9%
Mortgage Type
Commercial
Purchase Details
Closed on
Jul 26, 2007
Sold by
Walsh Richard
Bought by
Walsh Jeanette
Purchase Details
Closed on
Dec 1, 1997
Sold by
Kepple Lloyd R and Kepple Edna M
Bought by
Kepple Lloyd R and Kepple Edna M
Purchase Details
Closed on
Aug 15, 1997
Sold by
Kepple Lloyd R and Kepple Edna M
Bought by
Kepple Lloyd R and Kepple Edna M
Create a Home Valuation Report for This Property
The Home Valuation Report is an in-depth analysis detailing your home's value as well as a comparison with similar homes in the area
Home Values in the Area
Average Home Value in this Area
Purchase History
| Date | Buyer | Sale Price | Title Company |
|---|---|---|---|
| Dc Investments Three Llc | -- | Mid Valley Title | |
| Walsh Jeanette | -- | -- | |
| Dc Investments One Llc | $90,000 | Mid Valley Title & Escrow Co | |
| Walsh Jeanette | -- | None Available | |
| Kepple Lloyd R | -- | None Available | |
| Kepple Lloyd R | -- | None Available | |
| Kepple Lloyd R | -- | -- | |
| Kepple Lloyd R | -- | -- |
Source: Public Records
Mortgage History
| Date | Status | Borrower | Loan Amount |
|---|---|---|---|
| Open | Dc Investments Three Llc | $210,600 | |
| Previous Owner | Dc Investments One Llc | $108,000 |
Source: Public Records
Tax History
| Year | Tax Paid | Tax Assessment Tax Assessment Total Assessment is a certain percentage of the fair market value that is determined by local assessors to be the total taxable value of land and additions on the property. | Land | Improvement |
|---|---|---|---|---|
| 2025 | $2,505 | $175,098 | $79,590 | $95,508 |
| 2024 | $2,505 | $171,666 | $78,030 | $93,636 |
| 2023 | $2,442 | $168,300 | $76,500 | $91,800 |
| 2022 | $2,332 | $165,000 | $75,000 | $90,000 |
| 2021 | $1,330 | $52,684 | $8,097 | $44,587 |
| 2020 | $1,049 | $52,144 | $8,014 | $44,130 |
| 2019 | $1,039 | $51,122 | $7,857 | $43,265 |
| 2018 | $1,108 | $50,120 | $7,703 | $42,417 |
| 2017 | $989 | $49,138 | $7,552 | $41,586 |
| 2016 | $975 | $48,175 | $7,404 | $40,771 |
| 2015 | $934 | $47,452 | $7,293 | $40,159 |
| 2014 | $887 | $46,524 | $7,151 | $39,373 |
Source: Public Records
Map
Nearby Homes
- 2126 Gray St
- 2020 Gray St Unit 119
- 2020 Gray St
- 2079 Veatch St
- 2150 Gray St
- 2055 Veatch St
- 2155 Veatch St
- 2025 Veatch St
- 1515 Osage Ave
- 2111 Gray St
- 2175 Veatch St
- 1533 Osage Ave
- 2145 Gray St
- 2155 Gray St
- 1984 Gray St
- 1977 Veatch St Unit 4
- 1977 Veatch St Unit 3
- 1977 Veatch St Unit 1
- 1977 Veatch St
- 2185 Gray St
Your Personal Tour Guide
Ask me questions while you tour the home.