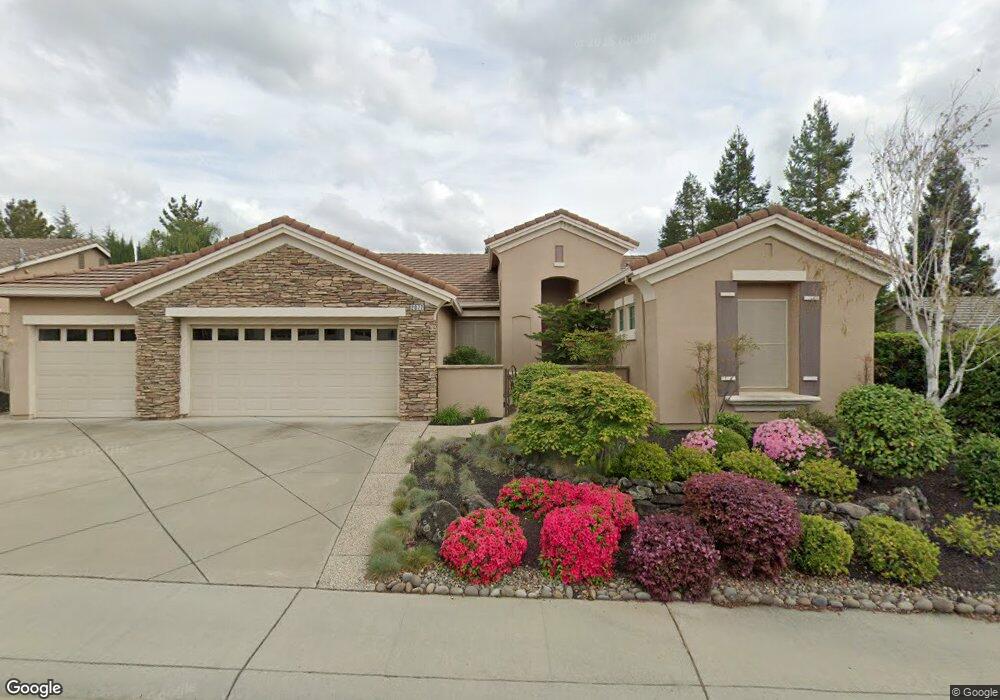
2077 Stonecrest Ln Lincoln, CA 95648
Sun City Lincoln Hills NeighborhoodEstimated Value: $755,000 - $823,000
2
Beds
3
Baths
2,360
Sq Ft
$336/Sq Ft
Est. Value
About This Home
This home is located at 2077 Stonecrest Ln, Lincoln, CA 95648 and is currently estimated at $793,987, approximately $336 per square foot. 2077 Stonecrest Ln is a home located in Placer County with nearby schools including Twelve Bridges Elementary School, Twelve Bridges Middle School, and John Adams Academy - Lincoln.
Ownership History
Date
Name
Owned For
Owner Type
Purchase Details
Closed on
Aug 19, 2020
Sold by
Carr Charles C and Carr Isabel
Bought by
Carr Charles C and Carr Isabel
Current Estimated Value
Purchase Details
Closed on
Nov 6, 2009
Sold by
Carr Charles C and Carr Isabel
Bought by
Carr Charles C and Carr Isabel
Home Financials for this Owner
Home Financials are based on the most recent Mortgage that was taken out on this home.
Original Mortgage
$337,000
Outstanding Balance
$218,127
Interest Rate
4.83%
Mortgage Type
New Conventional
Estimated Equity
$575,860
Purchase Details
Closed on
Mar 31, 2004
Sold by
Carr Charles C and Carr Isabel
Bought by
Carr Charles C and Carr Isabel
Purchase Details
Closed on
Dec 13, 2002
Sold by
Del Webb California Corp
Bought by
Carr Charles C and Carr Isabel
Home Financials for this Owner
Home Financials are based on the most recent Mortgage that was taken out on this home.
Original Mortgage
$259,000
Interest Rate
6.03%
Mortgage Type
Purchase Money Mortgage
Create a Home Valuation Report for This Property
The Home Valuation Report is an in-depth analysis detailing your home's value as well as a comparison with similar homes in the area
Home Values in the Area
Average Home Value in this Area
Purchase History
| Date | Buyer | Sale Price | Title Company |
|---|---|---|---|
| Carr Charles C | -- | None Available | |
| Carr Charles C | -- | Fidelity National Title Co | |
| Carr Charles C | -- | -- | |
| Carr Charles C | $399,500 | -- |
Source: Public Records
Mortgage History
| Date | Status | Borrower | Loan Amount |
|---|---|---|---|
| Open | Carr Charles C | $337,000 | |
| Closed | Carr Charles C | $259,000 |
Source: Public Records
Tax History Compared to Growth
Tax History
| Year | Tax Paid | Tax Assessment Tax Assessment Total Assessment is a certain percentage of the fair market value that is determined by local assessors to be the total taxable value of land and additions on the property. | Land | Improvement |
|---|---|---|---|---|
| 2025 | $7,921 | $578,106 | $98,476 | $479,630 |
| 2023 | $7,921 | $555,659 | $94,653 | $461,006 |
| 2022 | $8,094 | $544,765 | $92,798 | $451,967 |
| 2021 | $7,981 | $534,084 | $90,979 | $443,105 |
| 2020 | $7,951 | $528,609 | $90,047 | $438,562 |
| 2019 | $7,805 | $518,245 | $88,282 | $429,963 |
| 2018 | $7,645 | $508,084 | $86,551 | $421,533 |
| 2017 | $5,519 | $498,122 | $84,854 | $413,268 |
| 2016 | $5,394 | $488,356 | $83,191 | $405,165 |
| 2015 | $5,283 | $481,022 | $81,942 | $399,080 |
| 2014 | $5,155 | $471,600 | $80,337 | $391,263 |
Source: Public Records
Map
Nearby Homes
- 2076 Stonecrest Ln
- 1905 Mary Rose Ln
- 1509 Dapple Dawn Ln
- 1347 Rose Bouquet Dr
- 2182 Pebblestone Ln
- 2251 Pebblestone Ln
- 1260 Picket Fence Ln
- 1821 Carnelian Ct
- 1304 Rose Bouquet Dr
- 1647 Gingersnap Ln
- 2024 Farmgate Ln
- 109 Ivy Arbor Ct
- 1856 Farmgate Ln
- 2012 Gatehouse Ln
- 310 Dinis Cottage Ct
- 2966 Pulp Mill Ln
- 2984 Bowery Ln
- 2955 Pulp Mill Ln
- 2954 Pulp Mill Ln
- 2925 School House Ln
- 2079 Stonecrest Ln
- 2075 Stonecrest Ln
- 1905 Laurelhurst Ln
- 1895 Laurelhurst Ln
- 1915 Laurelhurst Ln
- 1885 Laurelhurst Ln
- 2078 Stonecrest Ln
- 2081 Stonecrest Ln
- 2080 Stonecrest Ln
- 2073 Stonecrest Ln
- 1875 Laurelhurst Ln
- 2082 Stonecrest Ln
- 1925 Laurelhurst Ln
- 2074 Stonecrest Ln
- 1940 Laurelhurst Ln
- 2061 Stonecrest Ln
- 2071 Stonecrest Ln
- 2084 Stonecrest Ln
- 2059 Stonecrest Ln
- 1985 Briarcliff Ln