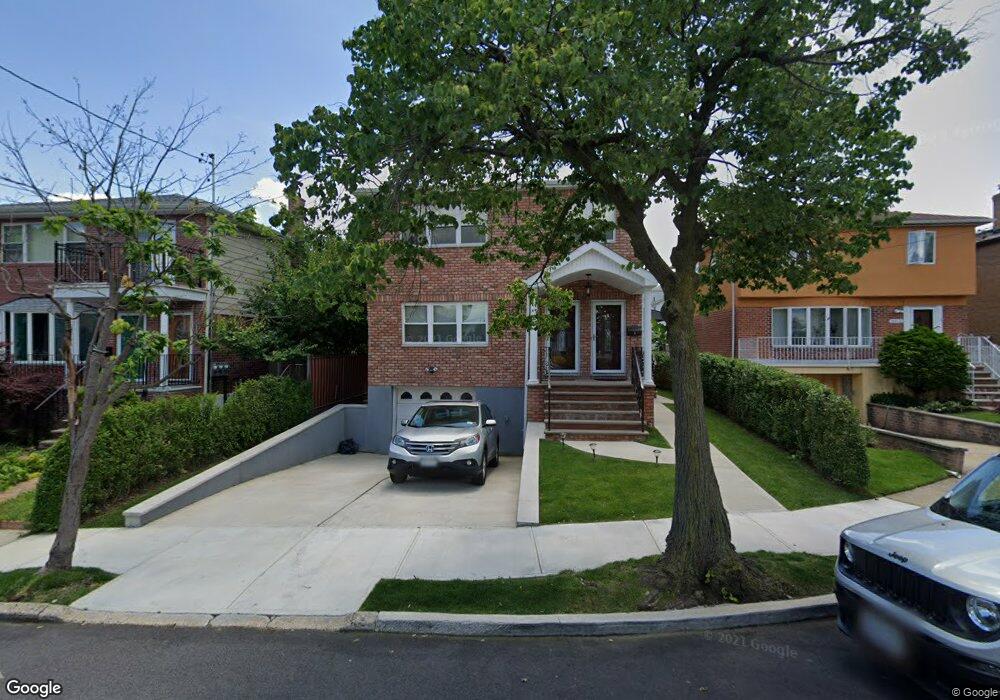
208-10 15th Ave Bayside, NY 11360
Bayside NeighborhoodEstimated Value: $1,330,713 - $1,716,000
3
Beds
2
Baths
2,514
Sq Ft
$597/Sq Ft
Est. Value
About This Home
This home is located at 208-10 15th Ave, Bayside, NY 11360 and is currently estimated at $1,500,178, approximately $596 per square foot. 208-10 15th Ave is a home located in Queens County with nearby schools including P.S. 209 - Clearview Gardens, J.H.S. 194 William Carr, and Bayside High School.
Ownership History
Date
Name
Owned For
Owner Type
Purchase Details
Closed on
May 10, 2024
Sold by
Stennett Jonathan M
Bought by
Stennett Robert J
Current Estimated Value
Home Financials for this Owner
Home Financials are based on the most recent Mortgage that was taken out on this home.
Original Mortgage
$780,000
Outstanding Balance
$764,604
Interest Rate
7.1%
Mortgage Type
Assumption
Estimated Equity
$735,574
Purchase Details
Closed on
Jun 25, 2015
Sold by
Pfaff Carol A and Pfaff Marie A
Bought by
Stennett Jonathan M and Stennett Robert J
Home Financials for this Owner
Home Financials are based on the most recent Mortgage that was taken out on this home.
Original Mortgage
$780,000
Interest Rate
3.83%
Mortgage Type
Purchase Money Mortgage
Create a Home Valuation Report for This Property
The Home Valuation Report is an in-depth analysis detailing your home's value as well as a comparison with similar homes in the area
Home Values in the Area
Average Home Value in this Area
Purchase History
| Date | Buyer | Sale Price | Title Company |
|---|---|---|---|
| Stennett Robert J | $750,000 | -- | |
| Stennett Robert J | $750,000 | -- | |
| Stennett Jonathan M | $780,000 | -- | |
| Stennett Jonathan M | $780,000 | -- |
Source: Public Records
Mortgage History
| Date | Status | Borrower | Loan Amount |
|---|---|---|---|
| Open | Stennett Robert J | $780,000 | |
| Closed | Stennett Robert J | $780,000 | |
| Closed | Stennett Jonathan M | $780,000 |
Source: Public Records
Tax History
| Year | Tax Paid | Tax Assessment Tax Assessment Total Assessment is a certain percentage of the fair market value that is determined by local assessors to be the total taxable value of land and additions on the property. | Land | Improvement |
|---|---|---|---|---|
| 2025 | $12,956 | $68,087 | $10,076 | $58,011 |
| 2024 | $12,956 | $64,505 | $9,651 | $54,854 |
| 2023 | $12,360 | $61,538 | $10,161 | $51,377 |
| 2022 | $11,685 | $86,760 | $13,860 | $72,900 |
| 2021 | $12,150 | $92,820 | $13,860 | $78,960 |
| 2020 | $12,010 | $91,560 | $13,860 | $77,700 |
| 2019 | $11,245 | $78,420 | $13,860 | $64,560 |
| 2018 | $10,454 | $51,282 | $9,823 | $41,459 |
| 2017 | $9,943 | $48,776 | $11,278 | $37,498 |
| 2016 | $8,644 | $48,776 | $11,278 | $37,498 |
| 2015 | $4,876 | $43,959 | $13,465 | $30,494 |
| 2014 | $4,876 | $41,472 | $14,661 | $26,811 |
Source: Public Records
Map
Nearby Homes
- 1423 209th St
- 208-08 Estates Dr Unit 22125
- 208-11 Estates Dr Unit 23128
- 210 E 15th St Unit 2D
- 210 E 15th St Unit 9L
- 210 E 15th St Unit 5H
- 208-18 15th Rd
- 207-22 Jordan Dr Unit 93 U
- 14-50 212th St Unit 102
- 15-06 212th St Unit 207
- 1530 212th St Unit 223
- 13-61 212th St Unit 2
- 20701 Estates Dr Unit 2nd FL - Unit 146M
- 13-31 209th St
- 14-14 Bonnie Ln
- 15-64 212th St Unit 252
- 14-81 212th St Unit 270
- 13-25 Estates Ln Unit 3F
- 13-16 212th St Unit Upper
- 15-63 212th St Unit 177
- 208-14 15th Ave Unit 1&B
- 208-14 15th Ave
- 208-14 15th Ave Unit 1fl.ba
- 208-06 15th Ave
- 20814 15th Ave
- 20814 15th Ave
- 20810 15th Ave
- 20806 15th Ave
- 1502 209th St
- 1506 209th St
- 208-09 15th Ave
- 20802 15th Ave
- 20802 15th Ave
- 20802 15th Ave
- 15-06 209th St Unit 1st Fl
- 1506 209th St Unit 1st Fl
- 208-11 15th Ave
- 208-11 15th Ave Unit 2nd Fl
- 208-17 15th Ave
- 20811 15th Ave
Your Personal Tour Guide
Ask me questions while you tour the home.