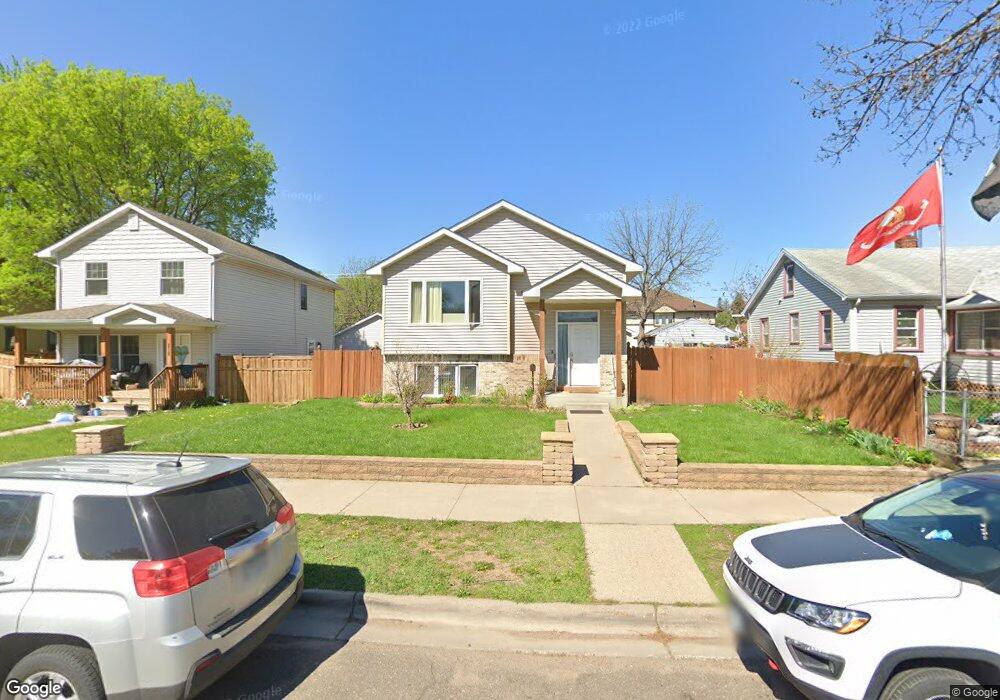
208 208 9th Ave S South St. Paul, MN 55075
Estimated Value: $349,000 - $371,457
4
Beds
2
Baths
1,080
Sq Ft
$334/Sq Ft
Est. Value
About This Home
This home is located at 208 208 9th Ave S, South St. Paul, MN 55075 and is currently estimated at $360,364, approximately $333 per square foot. 208 208 9th Ave S is a home located in Dakota County with nearby schools including Kaposia Education Center Elementary, South St. Paul Secondary, and Academic Arts High School.
Ownership History
Date
Name
Owned For
Owner Type
Purchase Details
Closed on
Nov 18, 2022
Sold by
Cordova Milton and Cordova Mildred
Bought by
Haldar Pallab
Current Estimated Value
Home Financials for this Owner
Home Financials are based on the most recent Mortgage that was taken out on this home.
Original Mortgage
$331,877
Outstanding Balance
$321,567
Interest Rate
6.94%
Mortgage Type
New Conventional
Estimated Equity
$38,797
Purchase Details
Closed on
Oct 29, 2009
Sold by
Almicar Cortes Oscar and Lopez Robles Olga
Bought by
Cordova Mitton W
Purchase Details
Closed on
Dec 18, 2006
Sold by
Brown Brothers Construction Inc
Bought by
Oscar Almicar Cortes and Lopez Almicar Javier
Create a Home Valuation Report for This Property
The Home Valuation Report is an in-depth analysis detailing your home's value as well as a comparison with similar homes in the area
Home Values in the Area
Average Home Value in this Area
Purchase History
| Date | Buyer | Sale Price | Title Company |
|---|---|---|---|
| Haldar Pallab | $338,000 | -- | |
| Cordova Mitton W | $145,000 | -- | |
| Oscar Almicar Cortes | $243,500 | -- |
Source: Public Records
Mortgage History
| Date | Status | Borrower | Loan Amount |
|---|---|---|---|
| Open | Haldar Pallab | $331,877 |
Source: Public Records
Tax History Compared to Growth
Tax History
| Year | Tax Paid | Tax Assessment Tax Assessment Total Assessment is a certain percentage of the fair market value that is determined by local assessors to be the total taxable value of land and additions on the property. | Land | Improvement |
|---|---|---|---|---|
| 2024 | $4,772 | $331,200 | $59,900 | $271,300 |
| 2023 | $4,772 | $343,500 | $60,200 | $283,300 |
| 2022 | $3,800 | $337,900 | $60,200 | $277,700 |
| 2021 | $4,804 | $283,200 | $52,300 | $230,900 |
| 2020 | $3,580 | $276,500 | $56,000 | $220,500 |
| 2019 | $3,268 | $269,800 | $53,300 | $216,500 |
| 2018 | $3,191 | $238,900 | $48,400 | $190,500 |
| 2017 | $2,789 | $225,200 | $46,200 | $179,000 |
| 2016 | $2,543 | $204,100 | $42,000 | $162,100 |
| 2015 | $2,458 | $161,140 | $35,415 | $125,725 |
| 2014 | -- | $165,173 | $35,578 | $129,595 |
| 2013 | -- | $143,155 | $30,447 | $112,708 |
Source: Public Records
Map
Nearby Homes