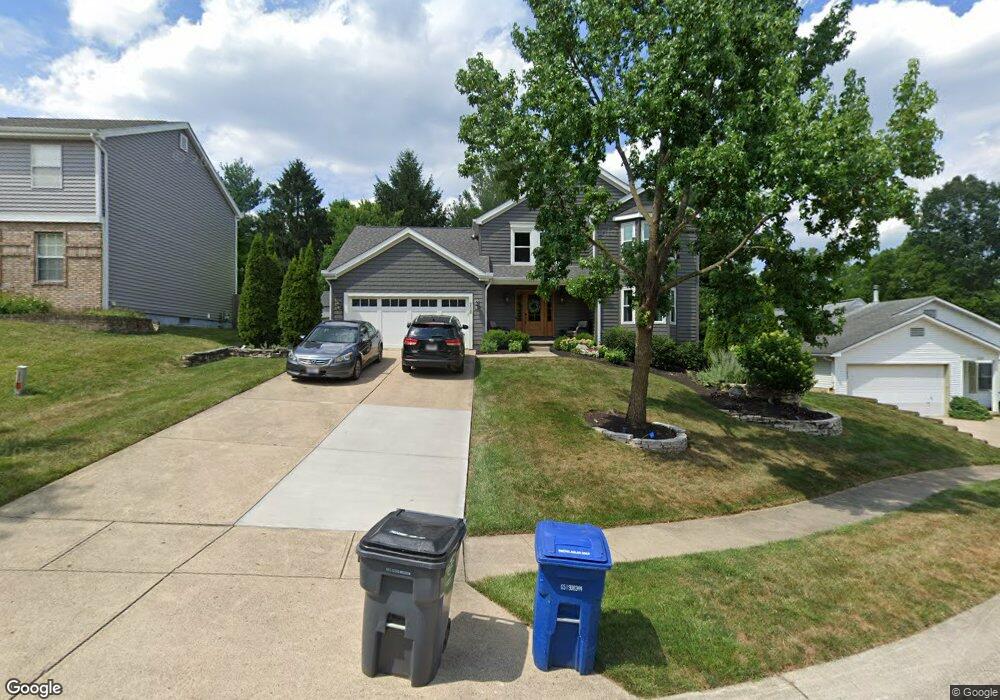
208 Ainsworth Ct Columbus, OH 43230
Woodside Green NeighborhoodEstimated Value: $410,000 - $449,000
3
Beds
4
Baths
1,949
Sq Ft
$219/Sq Ft
Est. Value
About This Home
This home is located at 208 Ainsworth Ct, Columbus, OH 43230 and is currently estimated at $427,529, approximately $219 per square foot. 208 Ainsworth Ct is a home located in Franklin County with nearby schools including Chapelfield Elementary School, Gahanna West Middle School, and Lincoln High School.
Ownership History
Date
Name
Owned For
Owner Type
Purchase Details
Closed on
Dec 12, 1990
Bought by
Deibel Christopher C
Current Estimated Value
Create a Home Valuation Report for This Property
The Home Valuation Report is an in-depth analysis detailing your home's value as well as a comparison with similar homes in the area
Home Values in the Area
Average Home Value in this Area
Purchase History
| Date | Buyer | Sale Price | Title Company |
|---|---|---|---|
| Deibel Christopher C | $124,200 | -- |
Source: Public Records
Tax History Compared to Growth
Tax History
| Year | Tax Paid | Tax Assessment Tax Assessment Total Assessment is a certain percentage of the fair market value that is determined by local assessors to be the total taxable value of land and additions on the property. | Land | Improvement |
|---|---|---|---|---|
| 2024 | $7,149 | $121,350 | $28,700 | $92,650 |
| 2023 | $7,059 | $121,350 | $28,700 | $92,650 |
| 2022 | $6,816 | $91,280 | $18,900 | $72,380 |
| 2021 | $6,593 | $91,280 | $18,900 | $72,380 |
| 2020 | $6,537 | $91,280 | $18,900 | $72,380 |
| 2019 | $5,461 | $76,090 | $15,750 | $60,340 |
| 2018 | $5,318 | $76,090 | $15,750 | $60,340 |
| 2017 | $5,012 | $76,090 | $15,750 | $60,340 |
| 2016 | $5,211 | $72,040 | $15,860 | $56,180 |
| 2015 | $5,215 | $72,040 | $15,860 | $56,180 |
| 2014 | $5,174 | $72,040 | $15,860 | $56,180 |
| 2013 | $2,570 | $72,030 | $15,855 | $56,175 |
Source: Public Records
Map
Nearby Homes
- 642 Ridenour Rd
- 108 Walcreek Dr W
- 111 Nob Hill Dr N
- 402 Bluestem Ave
- 536 Springwood Lake Dr
- 459 Bluestem Ave
- 211 Crossing Creek N
- 638 Thistle Ave
- 3544 Halpern St
- 0 Wendler Blvd
- 3877 Hines Rd
- 302 Zander Ln Unit 302
- 3150 Berkley Pointe Dr
- 3118 Berkley Pointe Dr
- 200 Glenhurst Ct
- 167 Greenbank Rd
- 3555 Tami Place
- 365 Sycamore Woods Ln Unit 365
- 388 Elkwood Place
- 158 Windrow Ct
- 216 Ainsworth Ct
- 200 Ainsworth Ct
- 224 Ainsworth Ct
- 205 Creighton Ct
- 213 Creighton Ct
- 192 Ainsworth Ct
- 219 Creighton Ct
- 199 Creighton Ct
- 227 Creighton Ct
- 207 Ainsworth Ct
- 215 Ainsworth Ct
- 232 Ainsworth Ave
- 191 Ainsworth Ct
- 223 Ainsworth Ct
- 199 Ainsworth Ct
- 233 Creighton Ct
- 764 Ridenour Rd
- 780 Ridenour Rd
- 241 Creighton Ct
- 200 Carlin Ct E