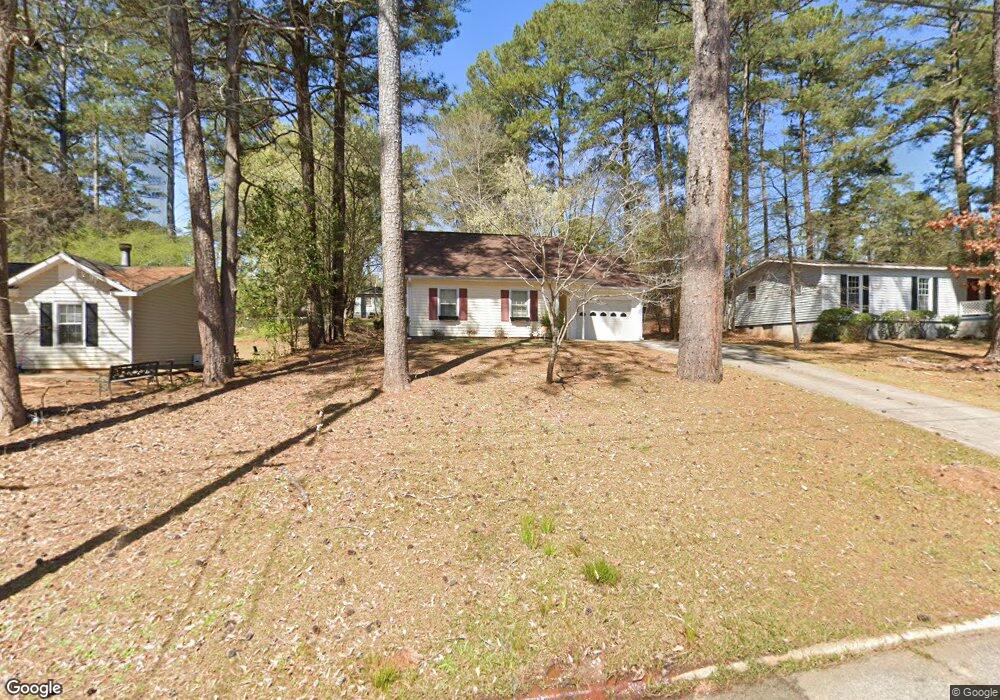
208 Chesterfield Place Lagrange, GA 30240
Estimated Value: $203,851 - $263,000
3
Beds
2
Baths
1,475
Sq Ft
$151/Sq Ft
Est. Value
About This Home
This home is located at 208 Chesterfield Place, Lagrange, GA 30240 and is currently estimated at $222,713, approximately $150 per square foot. 208 Chesterfield Place is a home located in Troup County with nearby schools including Franklin Forest Elementary School, Hollis Hand Elementary School, and Ethel W. Kight Elementary School.
Ownership History
Date
Name
Owned For
Owner Type
Purchase Details
Closed on
Feb 24, 2021
Sold by
Guerrero Michael
Bought by
Jamison Lamessia Denise
Current Estimated Value
Home Financials for this Owner
Home Financials are based on the most recent Mortgage that was taken out on this home.
Original Mortgage
$142,373
Outstanding Balance
$127,627
Interest Rate
2.7%
Mortgage Type
FHA
Estimated Equity
$95,086
Purchase Details
Closed on
Oct 14, 2009
Sold by
Thompson Phillip B
Bought by
Guerrero Michael
Home Financials for this Owner
Home Financials are based on the most recent Mortgage that was taken out on this home.
Original Mortgage
$98,188
Interest Rate
5.04%
Mortgage Type
FHA
Purchase Details
Closed on
May 27, 2004
Sold by
Peggy W Wilson
Bought by
Thompson Phillip B
Purchase Details
Closed on
Jul 9, 1984
Sold by
Hyatt William
Bought by
Peggy W Wilson
Purchase Details
Closed on
Apr 9, 1960
Sold by
Pitts C E
Bought by
Hyatt William
Create a Home Valuation Report for This Property
The Home Valuation Report is an in-depth analysis detailing your home's value as well as a comparison with similar homes in the area
Home Values in the Area
Average Home Value in this Area
Purchase History
| Date | Buyer | Sale Price | Title Company |
|---|---|---|---|
| Jamison Lamessia Denise | $145,000 | -- | |
| Guerrero Michael | $100,000 | -- | |
| Guerrero Michael | $100,000 | -- | |
| Thompson Phillip B | $88,000 | -- | |
| Peggy W Wilson | $5,000 | -- | |
| Hyatt William | -- | -- |
Source: Public Records
Mortgage History
| Date | Status | Borrower | Loan Amount |
|---|---|---|---|
| Open | Jamison Lamessia Denise | $142,373 | |
| Previous Owner | Guerrero Michael | $98,188 |
Source: Public Records
Tax History Compared to Growth
Tax History
| Year | Tax Paid | Tax Assessment Tax Assessment Total Assessment is a certain percentage of the fair market value that is determined by local assessors to be the total taxable value of land and additions on the property. | Land | Improvement |
|---|---|---|---|---|
| 2024 | $1,886 | $69,160 | $4,080 | $65,080 |
| 2023 | $1,568 | $57,480 | $4,080 | $53,400 |
| 2022 | $1,541 | $55,200 | $4,080 | $51,120 |
| 2021 | $1,577 | $54,280 | $4,080 | $50,200 |
| 2020 | $899 | $31,800 | $4,080 | $27,720 |
| 2019 | $833 | $29,600 | $4,080 | $25,520 |
| 2018 | $847 | $30,080 | $4,200 | $25,880 |
| 2017 | $847 | $30,080 | $4,200 | $25,880 |
| 2016 | $849 | $30,135 | $4,200 | $25,935 |
| 2015 | $847 | $30,023 | $4,088 | $25,935 |
| 2014 | $807 | $28,658 | $4,088 | $24,570 |
| 2013 | -- | $30,092 | $4,076 | $26,016 |
Source: Public Records
Map
Nearby Homes
- 203 S Chilton Crescent
- 201 S Chilton Crescent
- 106 S Chilton Crescent
- 724 Camellia Dr
- 100 Creekside Dr Unit LOT 60A
- 106 Ewing St
- 102 Ewing St
- 107 Dixie Creek Dr
- 748 Lakewood Dr
- 145 Turner St
- 204 Colonial St
- 110 Russell St
- 900 North St
- 806 New Franklin Rd
- 114 Briarcliff Rd
- 109 Thomas St
- 219 Banks St
- 705 Piney Woods Dr
- 127 Ashling Dr
- 603 Country Club Rd
- 0 Chesterfield Place Unit 7495171
- 0 Chesterfield Place Unit 7408603
- 210 Chesterfield Place
- 207 Chesterfield Place
- 202 Chesterfield Place
- 212 Chesterfield Place
- 205 Chesterfield Place
- 205 S Chilton Crescent
- 209 Chesterfield Place
- 211 S Chilton Crescent
- 211 S Chilton Crescent Unit 6
- 100 Chesterfield Place
- 201 Chesterfield Place
- 804 Camellia Dr
- 200 Warwick Rd
- 802 Camellia Dr
- 806 Camellia Dr
- 800 Camellia Dr
- 210 S Chilton Crescent
- 145 Marlboro Way