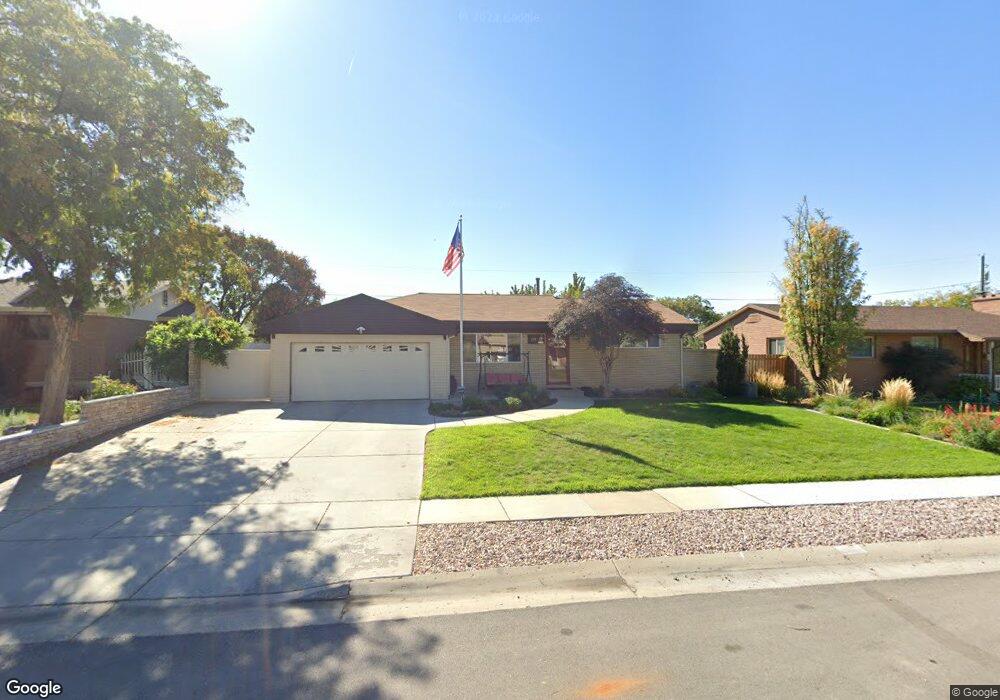
208 E Marla Way Midvale, UT 84047
Estimated Value: $535,000 - $539,000
4
Beds
2
Baths
1,768
Sq Ft
$304/Sq Ft
Est. Value
About This Home
This home is located at 208 E Marla Way, Midvale, UT 84047 and is currently estimated at $537,273, approximately $303 per square foot. 208 E Marla Way is a home located in Salt Lake County with nearby schools including Midvalley Elementary School, Hillcrest High School, and Midvale Middle School.
Ownership History
Date
Name
Owned For
Owner Type
Purchase Details
Closed on
Sep 10, 2020
Sold by
Stephenson Dennis and Stephenson Pauleen Dygert
Bought by
Stokes Reed C and Stokes Colleen A
Current Estimated Value
Purchase Details
Closed on
Apr 26, 2010
Sold by
Stephenson Dennis and Stephenson Pauleen Dygert
Bought by
Stephenson Dennis and Stephenson Pauleen Dygert
Home Financials for this Owner
Home Financials are based on the most recent Mortgage that was taken out on this home.
Original Mortgage
$165,000
Interest Rate
4.92%
Mortgage Type
VA
Create a Home Valuation Report for This Property
The Home Valuation Report is an in-depth analysis detailing your home's value as well as a comparison with similar homes in the area
Home Values in the Area
Average Home Value in this Area
Purchase History
| Date | Buyer | Sale Price | Title Company |
|---|---|---|---|
| Stokes Reed C | -- | Highland Title Agency | |
| Stephenson Dennis | -- | Monument Title Ins Co | |
| Stephenson Dennis | -- | Monument Title Ins Co |
Source: Public Records
Mortgage History
| Date | Status | Borrower | Loan Amount |
|---|---|---|---|
| Previous Owner | Stephenson Dennis | $165,000 |
Source: Public Records
Tax History
| Year | Tax Paid | Tax Assessment Tax Assessment Total Assessment is a certain percentage of the fair market value that is determined by local assessors to be the total taxable value of land and additions on the property. | Land | Improvement |
|---|---|---|---|---|
| 2025 | $2,931 | $505,500 | $156,600 | $348,900 |
| 2024 | $2,931 | $481,200 | $147,000 | $334,200 |
| 2023 | $2,890 | $470,200 | $139,800 | $330,400 |
| 2022 | $3,016 | $479,300 | $137,100 | $342,200 |
| 2021 | $2,691 | $365,700 | $137,100 | $228,600 |
| 2020 | $2,040 | $262,300 | $91,500 | $170,800 |
| 2019 | $48 | $248,500 | $86,300 | $162,200 |
Source: Public Records
Map
Nearby Homes
- 7377 S Ramanee Dr
- 7222 S 160 E Unit 3
- 7214 S 160 E Unit 1
- 106 E 7320 S
- 221 E Fort Union Blvd
- 72 E 7320 S
- 7218 S Viansa Ct
- 7097 S 230 E
- 7309 S Union Village Cir
- 220 E Greenwood Ave
- 195 E 7060 S
- 7045 S 300 E
- 7187 S 420 E
- 489 E 7800 S Unit 2
- 392 W Chadam Way S Unit 62
- 7342 S Seven Tree Ln W Unit 77
- 7329 S Seven Tree Ln W Unit 85
- 7327 S Seven Tree Ln W Unit 86
- 7337 S Seven Tree Ln W Unit 82
- 386 W Chadam Way S Unit 64
Your Personal Tour Guide
Ask me questions while you tour the home.