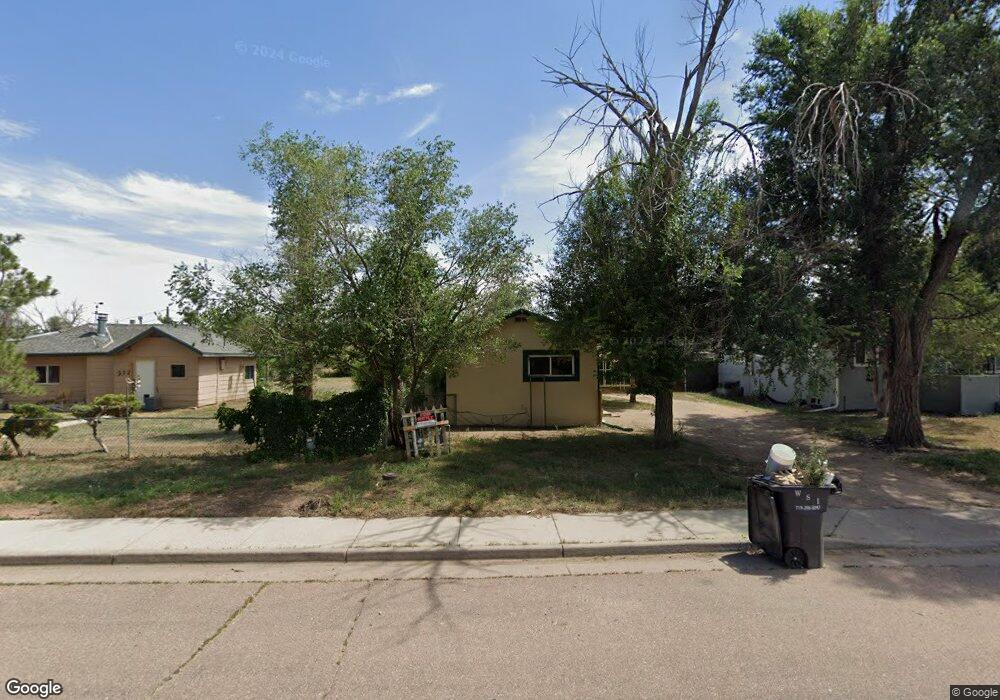
208 E Missouri Ave Fountain, CO 80817
Downtown Fountain NeighborhoodEstimated Value: $272,000 - $334,000
2
Beds
2
Baths
1,265
Sq Ft
$238/Sq Ft
Est. Value
About This Home
This home is located at 208 E Missouri Ave, Fountain, CO 80817 and is currently estimated at $300,916, approximately $237 per square foot. 208 E Missouri Ave is a home located in El Paso County with nearby schools including Aragon Elementary School, Fountain Middle School, and Fountain-Fort Carson High School.
Ownership History
Date
Name
Owned For
Owner Type
Purchase Details
Closed on
Jun 15, 2019
Sold by
Ridley Hong
Bought by
Hong Dong Silver Llc
Current Estimated Value
Purchase Details
Closed on
May 31, 2017
Sold by
Shaffeer Jessie J
Bought by
Ridley Hong
Home Financials for this Owner
Home Financials are based on the most recent Mortgage that was taken out on this home.
Original Mortgage
$112,750
Interest Rate
3.97%
Mortgage Type
Commercial
Purchase Details
Closed on
Feb 2, 2009
Sold by
Federal Home Loan Mortgage Corporation
Bought by
Shaffer Jessie J
Purchase Details
Closed on
Feb 25, 2005
Sold by
Farrell Laura P
Bought by
Roberts Laura P
Home Financials for this Owner
Home Financials are based on the most recent Mortgage that was taken out on this home.
Original Mortgage
$55,000
Interest Rate
5.77%
Mortgage Type
Commercial
Purchase Details
Closed on
Aug 30, 1991
Bought by
Ridley Hong
Purchase Details
Closed on
Oct 23, 1989
Bought by
Ridley Hong
Create a Home Valuation Report for This Property
The Home Valuation Report is an in-depth analysis detailing your home's value as well as a comparison with similar homes in the area
Home Values in the Area
Average Home Value in this Area
Purchase History
| Date | Buyer | Sale Price | Title Company |
|---|---|---|---|
| Hong Dong Silver Llc | -- | None Available | |
| Ridley Hong | $150,000 | First American Title | |
| Shaffer Jessie J | $19,000 | None Available | |
| Roberts Laura P | -- | Clear Title | |
| Ridley Hong | $15,000 | -- | |
| Ridley Hong | -- | -- |
Source: Public Records
Mortgage History
| Date | Status | Borrower | Loan Amount |
|---|---|---|---|
| Previous Owner | Ridley Hong | $112,750 | |
| Previous Owner | Roberts Laura P | $55,000 |
Source: Public Records
Tax History Compared to Growth
Tax History
| Year | Tax Paid | Tax Assessment Tax Assessment Total Assessment is a certain percentage of the fair market value that is determined by local assessors to be the total taxable value of land and additions on the property. | Land | Improvement |
|---|---|---|---|---|
| 2025 | $828 | $19,460 | -- | -- |
| 2024 | $695 | $17,650 | $2,170 | $15,480 |
| 2022 | $733 | $12,570 | $1,690 | $10,880 |
| 2021 | $696 | $13,220 | $1,780 | $11,440 |
| 2020 | $589 | $10,950 | $1,560 | $9,390 |
| 2019 | $578 | $10,950 | $1,560 | $9,390 |
| 2018 | $443 | $8,110 | $1,380 | $6,730 |
| 2017 | $438 | $8,110 | $1,380 | $6,730 |
| 2016 | $401 | $7,420 | $1,380 | $6,040 |
| 2015 | $402 | $7,420 | $1,380 | $6,040 |
| 2014 | $360 | $6,690 | $1,380 | $5,310 |
Source: Public Records
Map
Nearby Homes
- 329 E Missouri Ave
- 119 E Ohio Ave Unit 11 & 12
- 0 E Virginia Ave
- 508 E Ohio Ave
- 212 S Reed St
- 204 S Reed St
- 10581 Traders Pkwy
- 157 Wellington St
- 537 Blossom Field Rd
- 545 Blossom Field Rd
- 617 Autumn Place
- 601 Autumn Place
- 575 Blossom Field Rd
- 900 Pond Terrace
- 307 Mount View Ln
- 579 Blossom Field Rd
- 10677 Traders Pkwy
- 10747 Hidden Prairie Pkwy
- 119 & 121 E Ohio Ave
- 323 Mount View Ln
- 208 E Missouri Ave Unit 1
- 206 E Missouri Ave
- 212 E Missouri Ave
- 203 E Missouri Ave
- 211 E Missouri Ave
- 222 E Missouri Ave
- 116 E Missouri Ave
- 217 E Missouri Ave
- 121 E Missouri Ave
- 221 E Missouri Ave
- 288 E Missouri Ave
- 204 E Ohio Ave
- 112 E Missouri Ave
- 290 E Missouri Ave
- 220 E Ohio Ave
- 219 E Missouri Ave
- 305 E Missouri Ave
- 304 E Missouri Ave
- 311 E Missouri Ave
- 317 E Missouri Ave