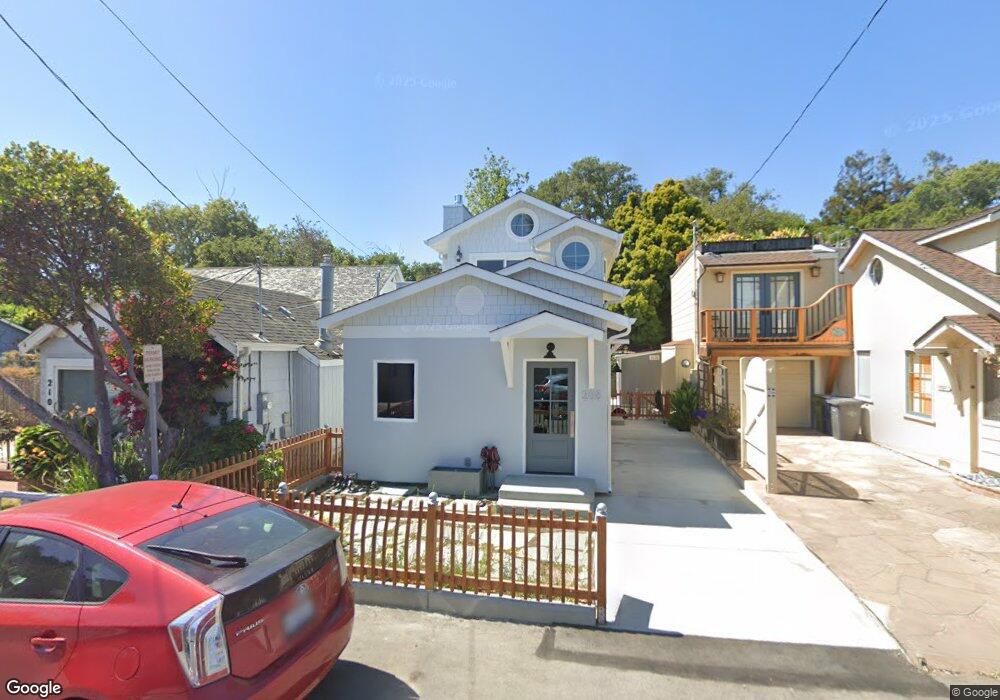
208 Fanmar Way Capitola, CA 95010
Estimated Value: $1,084,911 - $1,494,000
2
Beds
2
Baths
1,128
Sq Ft
$1,180/Sq Ft
Est. Value
About This Home
This home is located at 208 Fanmar Way, Capitola, CA 95010 and is currently estimated at $1,330,728, approximately $1,179 per square foot. 208 Fanmar Way is a home located in Santa Cruz County with nearby schools including Main Street Elementary School, New Brighton Middle School, and Mission Hill Middle School.
Ownership History
Date
Name
Owned For
Owner Type
Purchase Details
Closed on
Jun 2, 2020
Sold by
Johnson Brooke Kady
Bought by
Johnson Brooke Kady and Brooke Kady Johnson Family Tru
Current Estimated Value
Purchase Details
Closed on
Jul 18, 2018
Sold by
Beslin Karri Kady and Johnson Brooke Kady
Bought by
Johnson Brook Kady
Purchase Details
Closed on
Apr 7, 1997
Sold by
Kady Brooks W and 1993 Kady Family Tru
Bought by
Kady Brooks W and Kady Sonya R
Home Financials for this Owner
Home Financials are based on the most recent Mortgage that was taken out on this home.
Original Mortgage
$37,000
Outstanding Balance
$4,688
Interest Rate
7.66%
Estimated Equity
$1,326,040
Purchase Details
Closed on
Sep 27, 1994
Sold by
Narver Richard L and Narver Donald Fowler
Bought by
Kady Brooks W and Kady Sonya
Create a Home Valuation Report for This Property
The Home Valuation Report is an in-depth analysis detailing your home's value as well as a comparison with similar homes in the area
Home Values in the Area
Average Home Value in this Area
Purchase History
| Date | Buyer | Sale Price | Title Company |
|---|---|---|---|
| Johnson Brooke Kady | -- | None Available | |
| Johnson Brook Kady | -- | None Available | |
| Kady Brooks W | -- | First American Title Ins Co | |
| Kady Brooks W | $101,000 | Old Republic Title Company |
Source: Public Records
Mortgage History
| Date | Status | Borrower | Loan Amount |
|---|---|---|---|
| Open | Kady Brooks W | $37,000 |
Source: Public Records
Tax History
| Year | Tax Paid | Tax Assessment Tax Assessment Total Assessment is a certain percentage of the fair market value that is determined by local assessors to be the total taxable value of land and additions on the property. | Land | Improvement |
|---|---|---|---|---|
| 2025 | $3,916 | $250,225 | $169,653 | $80,572 |
| 2023 | $3,794 | $240,509 | $163,065 | $77,444 |
| 2022 | $3,717 | $235,793 | $159,868 | $75,925 |
| 2021 | $3,605 | $231,169 | $156,733 | $74,436 |
| 2020 | $3,549 | $228,799 | $155,126 | $73,673 |
| 2019 | $3,466 | $224,314 | $152,085 | $72,229 |
| 2018 | $3,391 | $219,914 | $149,102 | $70,812 |
| 2017 | $3,336 | $215,601 | $146,178 | $69,423 |
| 2016 | $3,184 | $211,374 | $143,312 | $68,062 |
Source: Public Records
Map
Nearby Homes
- 322 Capitola Ave
- 208 Capitola Ave
- 318 Park Ave
- 1790 48th Ave
- 625 Gilroy Dr
- 1435 47th Ave
- 620 El Salto Dr
- 1925 46th Ave Unit 71
- 1925 46th Ave Unit 60
- 1925 46th Ave Unit 121
- 300 Plum St Unit 23
- 4605 Opal St
- 750 47th Ave Unit 56
- 750 47th Ave Unit 69
- 1771 44th Ave
- 4460 Diamond St Unit 4
- 4435 Diamond St Unit 2
- 2155 Wharf Rd Unit 12
- 930 Rosedale Ave Unit 64
- 4425 Clares St Unit 3
- 210 Fanmar Way
- 206 Fanmar Way
- 212 Fanmar Way
- 204 Fanmar Way
- 203 Fanmar Way
- 212 Terrace Way
- 209 Fanmar Way
- 209 Fanmar Way
- 214 Fanmar Way
- 202 Fanmar Way
- 201 Fanmar Way
- 208 Terrace Way
- 302 Fanmar Way
- 112 Fanmar Way
- 107 Fanmar Way
- 206 Terrace Way
- 304 Fanmar Way
- 110 Fanmar Way
- 204 Terrace Way
- 109 Fanmar Way
Your Personal Tour Guide
Ask me questions while you tour the home.