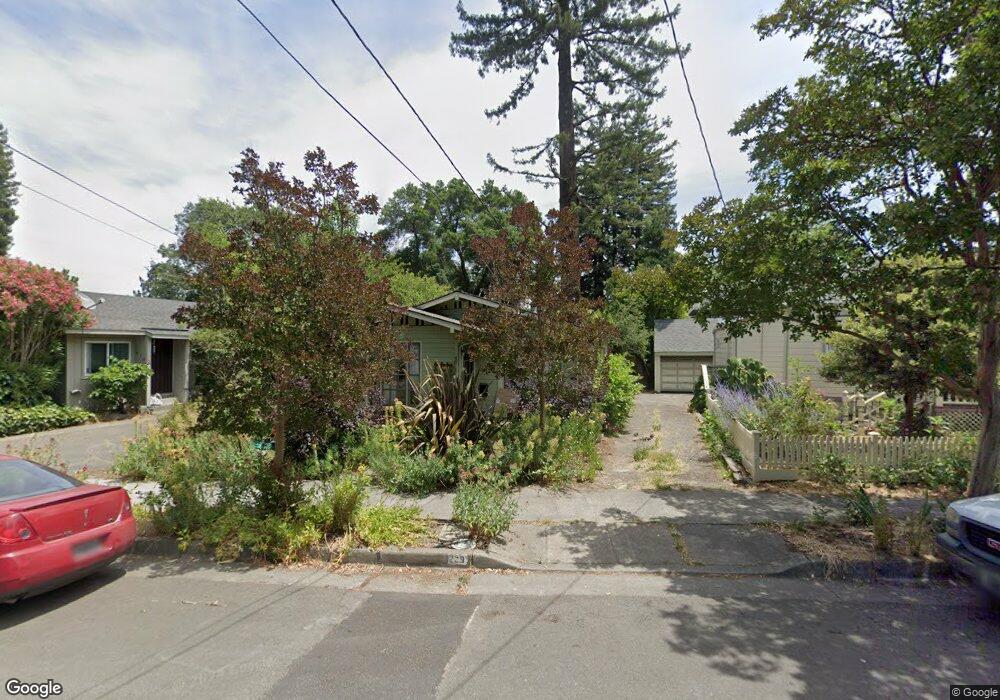
208 Fitch St Healdsburg, CA 95448
Estimated Value: $840,920 - $1,190,000
2
Beds
1
Bath
764
Sq Ft
$1,271/Sq Ft
Est. Value
About This Home
This home is located at 208 Fitch St, Healdsburg, CA 95448 and is currently estimated at $970,980, approximately $1,270 per square foot. 208 Fitch St is a home located in Sonoma County with nearby schools including Healdsburg Elementary School, Healdsburg Junior High School, and Healdsburg High School.
Ownership History
Date
Name
Owned For
Owner Type
Purchase Details
Closed on
Oct 8, 2009
Sold by
Sinunu James N and Struck Jeane
Bought by
Sinunu James N and Struck Jeane
Current Estimated Value
Purchase Details
Closed on
Jan 25, 2005
Sold by
Greco Alfred
Bought by
Greco Alfred and Greco Betty F
Purchase Details
Closed on
Mar 3, 2003
Sold by
Bissell Laura E
Bought by
Sinunu James N and Struck Jeane
Home Financials for this Owner
Home Financials are based on the most recent Mortgage that was taken out on this home.
Original Mortgage
$308,000
Outstanding Balance
$131,925
Interest Rate
5.83%
Estimated Equity
$839,055
Purchase Details
Closed on
Oct 8, 1993
Sold by
Bissell Laura E
Bought by
Bissell Laura E
Home Financials for this Owner
Home Financials are based on the most recent Mortgage that was taken out on this home.
Original Mortgage
$76,500
Interest Rate
7.12%
Create a Home Valuation Report for This Property
The Home Valuation Report is an in-depth analysis detailing your home's value as well as a comparison with similar homes in the area
Home Values in the Area
Average Home Value in this Area
Purchase History
| Date | Buyer | Sale Price | Title Company |
|---|---|---|---|
| Sinunu James N | -- | None Available | |
| Greco Alfred | -- | -- | |
| Greco Alfred | -- | -- | |
| Sinunu James N | $385,000 | North American Title Co | |
| Bissell Laura E | -- | First American Title |
Source: Public Records
Mortgage History
| Date | Status | Borrower | Loan Amount |
|---|---|---|---|
| Open | Sinunu James N | $308,000 | |
| Previous Owner | Bissell Laura E | $76,500 |
Source: Public Records
Tax History Compared to Growth
Tax History
| Year | Tax Paid | Tax Assessment Tax Assessment Total Assessment is a certain percentage of the fair market value that is determined by local assessors to be the total taxable value of land and additions on the property. | Land | Improvement |
|---|---|---|---|---|
| 2025 | $6,432 | $557,599 | $289,663 | $267,936 |
| 2024 | $6,432 | $546,667 | $283,984 | $262,683 |
| 2023 | $6,432 | $535,949 | $278,416 | $257,533 |
| 2022 | $6,260 | $525,441 | $272,957 | $252,484 |
| 2021 | $6,203 | $515,139 | $267,605 | $247,534 |
| 2020 | $6,140 | $509,858 | $264,862 | $244,996 |
| 2019 | $6,013 | $499,862 | $259,669 | $240,193 |
| 2018 | $5,898 | $490,062 | $254,578 | $235,484 |
| 2017 | $5,756 | $480,454 | $249,587 | $230,867 |
| 2016 | $5,446 | $471,035 | $244,694 | $226,341 |
| 2015 | $5,351 | $463,961 | $241,019 | $222,942 |
| 2014 | $4,428 | $375,000 | $195,000 | $180,000 |
Source: Public Records
Map
Nearby Homes
- 423 Matheson St
- 171 Sawmill Cir Unit 102
- 151 Sawmill Cir Unit 201
- 532 Matheson St
- 131 Sawmill Cir Unit 101
- 131 Sawmill Cir Unit 203
- 431 University St
- 541 Mason St Unit 8
- 16 Adeline Way
- 37 Front St Unit E
- 523 Center St
- 421 Tee Dr
- 620 Brown St
- 635 Brown St
- 1580 Magnolia Dr
- 374 Kinley Dr
- 199 W Matheson St
- 401 Fairway Ct
- 532 Grove St
- 800 S Fitch Mountain Rd