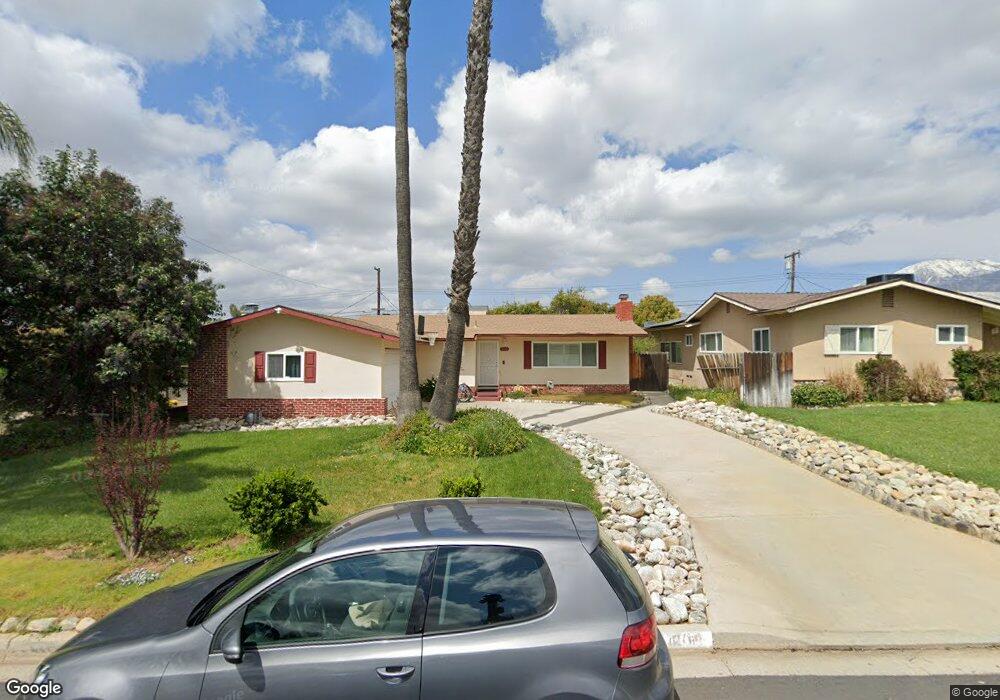
208 Harruby Dr Calimesa, CA 92320
Estimated Value: $431,000 - $481,000
3
Beds
2
Baths
1,144
Sq Ft
$399/Sq Ft
Est. Value
About This Home
This home is located at 208 Harruby Dr, Calimesa, CA 92320 and is currently estimated at $456,283, approximately $398 per square foot. 208 Harruby Dr is a home located in Riverside County with nearby schools including Calimesa Elementary, Mesa View Middle School, and Yucaipa High School.
Ownership History
Date
Name
Owned For
Owner Type
Purchase Details
Closed on
Mar 14, 2013
Sold by
Gauronski Catherine A
Bought by
Gauronski Steven M and Gauronski Catherine A
Current Estimated Value
Home Financials for this Owner
Home Financials are based on the most recent Mortgage that was taken out on this home.
Original Mortgage
$75,000
Outstanding Balance
$34,369
Interest Rate
3.49%
Mortgage Type
New Conventional
Estimated Equity
$421,914
Purchase Details
Closed on
May 15, 2003
Sold by
Smith Brant D and Smith Barbara F
Bought by
Coughtry Catherine A
Home Financials for this Owner
Home Financials are based on the most recent Mortgage that was taken out on this home.
Original Mortgage
$139,920
Outstanding Balance
$59,659
Interest Rate
5.53%
Mortgage Type
Purchase Money Mortgage
Estimated Equity
$396,624
Purchase Details
Closed on
Jun 23, 2000
Sold by
Collins Eula Maxine M
Bought by
Smith Brant D and Smith Barbara F
Home Financials for this Owner
Home Financials are based on the most recent Mortgage that was taken out on this home.
Original Mortgage
$113,068
Interest Rate
8.37%
Mortgage Type
FHA
Create a Home Valuation Report for This Property
The Home Valuation Report is an in-depth analysis detailing your home's value as well as a comparison with similar homes in the area
Home Values in the Area
Average Home Value in this Area
Purchase History
| Date | Buyer | Sale Price | Title Company |
|---|---|---|---|
| Gauronski Steven M | -- | Placer Title Company | |
| Coughtry Catherine A | $175,000 | Chicago Title Co | |
| Smith Brant D | $114,000 | Commonwealth Land Title Co |
Source: Public Records
Mortgage History
| Date | Status | Borrower | Loan Amount |
|---|---|---|---|
| Open | Gauronski Steven M | $75,000 | |
| Open | Coughtry Catherine A | $139,920 | |
| Previous Owner | Smith Brant D | $113,068 | |
| Closed | Smith Brant D | $4,223 | |
| Closed | Coughtry Catherine A | $34,980 |
Source: Public Records
Tax History Compared to Growth
Tax History
| Year | Tax Paid | Tax Assessment Tax Assessment Total Assessment is a certain percentage of the fair market value that is determined by local assessors to be the total taxable value of land and additions on the property. | Land | Improvement |
|---|---|---|---|---|
| 2025 | $3,035 | $253,282 | $57,917 | $195,365 |
| 2023 | $3,035 | $243,449 | $55,669 | $187,780 |
| 2022 | $2,937 | $238,677 | $54,578 | $184,099 |
| 2021 | $2,900 | $233,998 | $53,508 | $180,490 |
| 2020 | $2,897 | $231,600 | $52,960 | $178,640 |
| 2019 | $2,774 | $227,060 | $51,922 | $175,138 |
| 2018 | $2,748 | $222,608 | $50,905 | $171,703 |
| 2017 | $2,688 | $218,244 | $49,907 | $168,337 |
| 2016 | $2,636 | $213,966 | $48,929 | $165,037 |
| 2015 | $2,608 | $210,754 | $48,195 | $162,559 |
| 2014 | $2,555 | $206,627 | $47,251 | $159,376 |
Source: Public Records
Map
Nearby Homes
- 199 Summit View Dr Unit B
- 199 Summit View Dr Unit E
- 147 Myrtlewood Dr
- 244 Country Club Dr
- 1278 2nd Place
- 1286 Pinehurst Dr
- 216 Colonial Dr
- 1156 3rd St
- 0 Slack Place
- 1334 Pinehurst Dr
- 293 Country Club Dr
- 1254 Heritage Dr
- 169 Victoria Ln
- 372 Sandalwood Dr
- 950 California St Unit 100
- 950 California St Unit 111
- 950 California St Unit 60
- 384 Sandalwood Dr
- 832 Hilltop Ct
- 406 Myrtlewood Dr
- 202 Harruby Dr
- 212 Harruby Dr
- 207 Myrtlewood Dr
- 198 Harruby Dr
- 218 Harruby Dr
- 211 Myrtlewood Dr
- 203 Myrtlewood Dr
- 207 Harruby Dr
- 197 Myrtlewood Dr
- 217 Myrtlewood Dr
- 201 Harruby Dr
- 211 Harruby Dr
- 194 Harruby Dr
- 222 Harruby Dr
- 217 Harruby Dr
- 197 Harruby Dr
- 193 Myrtlewood Dr
- 221 Myrtlewood Dr
- 193 Harruby Dr
- 221 Harruby Dr