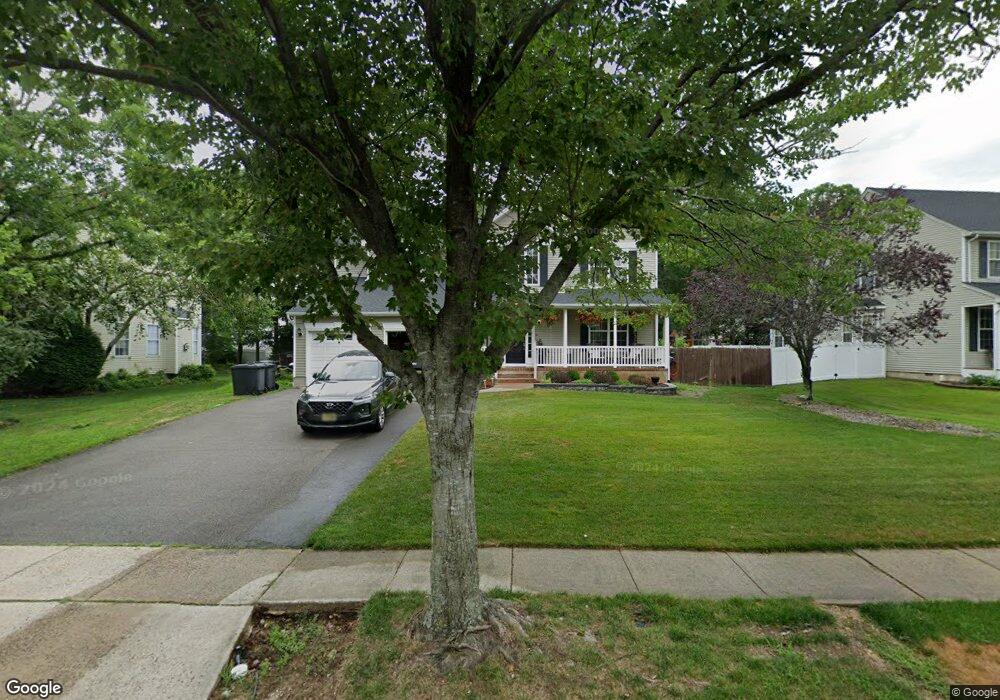
208 Laurel Ct West Creek, NJ 08092
Stafford NeighborhoodEstimated Value: $666,238 - $785,000
4
Beds
3
Baths
2,800
Sq Ft
$260/Sq Ft
Est. Value
About This Home
This home is located at 208 Laurel Ct, West Creek, NJ 08092 and is currently estimated at $727,310, approximately $259 per square foot. 208 Laurel Ct is a home located in Ocean County with nearby schools including Oxycocus Elementary School, Ocean Acres Elementary School, and McKinley Avenue Elementary School.
Ownership History
Date
Name
Owned For
Owner Type
Purchase Details
Closed on
Mar 26, 2014
Sold by
Henderson Troy
Bought by
Henderson Deborah
Current Estimated Value
Purchase Details
Closed on
Apr 8, 2008
Sold by
Rizzo Raymond and Rizzo Janet M
Bought by
Irwin Richard D and Irwin Staci B
Home Financials for this Owner
Home Financials are based on the most recent Mortgage that was taken out on this home.
Original Mortgage
$310,000
Outstanding Balance
$197,700
Interest Rate
6.1%
Mortgage Type
Purchase Money Mortgage
Estimated Equity
$529,610
Purchase Details
Closed on
Sep 11, 1997
Sold by
Tupper Lake Inc
Bought by
Sipler Gregg M and Sipler Ann R
Home Financials for this Owner
Home Financials are based on the most recent Mortgage that was taken out on this home.
Original Mortgage
$167,000
Interest Rate
7.31%
Create a Home Valuation Report for This Property
The Home Valuation Report is an in-depth analysis detailing your home's value as well as a comparison with similar homes in the area
Home Values in the Area
Average Home Value in this Area
Purchase History
| Date | Buyer | Sale Price | Title Company |
|---|---|---|---|
| Henderson Deborah | -- | None Available | |
| Irwin Richard D | $425,000 | Chicago Title Insurance Co | |
| Sipler Gregg M | $235,549 | -- |
Source: Public Records
Mortgage History
| Date | Status | Borrower | Loan Amount |
|---|---|---|---|
| Open | Irwin Richard D | $310,000 | |
| Previous Owner | Sipler Gregg M | $167,000 |
Source: Public Records
Tax History Compared to Growth
Tax History
| Year | Tax Paid | Tax Assessment Tax Assessment Total Assessment is a certain percentage of the fair market value that is determined by local assessors to be the total taxable value of land and additions on the property. | Land | Improvement |
|---|---|---|---|---|
| 2025 | $9,093 | $366,200 | $88,600 | $277,600 |
| 2024 | $9,005 | $366,200 | $88,600 | $277,600 |
| 2023 | $8,620 | $366,200 | $88,600 | $277,600 |
| 2022 | $8,620 | $366,200 | $88,600 | $277,600 |
| 2021 | $8,503 | $366,200 | $88,600 | $277,600 |
| 2020 | $8,498 | $365,500 | $88,600 | $276,900 |
| 2019 | $8,377 | $365,500 | $88,600 | $276,900 |
| 2018 | $8,326 | $365,500 | $88,600 | $276,900 |
| 2017 | $8,398 | $356,900 | $88,600 | $268,300 |
| 2016 | $8,312 | $356,900 | $88,600 | $268,300 |
| 2015 | $8,020 | $356,900 | $88,600 | $268,300 |
| 2014 | $7,699 | $338,400 | $88,600 | $249,800 |
Source: Public Records
Map
Nearby Homes
- 71 Oak Ridge Ln
- 75 Perry Ln
- 36 Fort Lee Dr
- 30 Fort Lee Dr
- 40 Pine Grove Ave
- 15 Cedar Hill Dr
- 1076 S Main St
- 303 S Lakeshore Dr
- 106 Bryce Ln Unit 802
- 49 Oxycocus Rd
- 84 Jennings Rd
- 25 N Union St
- 76 Beach Ave
- 670 Julian Ct
- 34 Holly Rd
- 26 Osprey Ave
- 138 Bradshaw Dr
- 159 Littleworth Rd
- 295 N Main St
- 155 Littleworth Rd