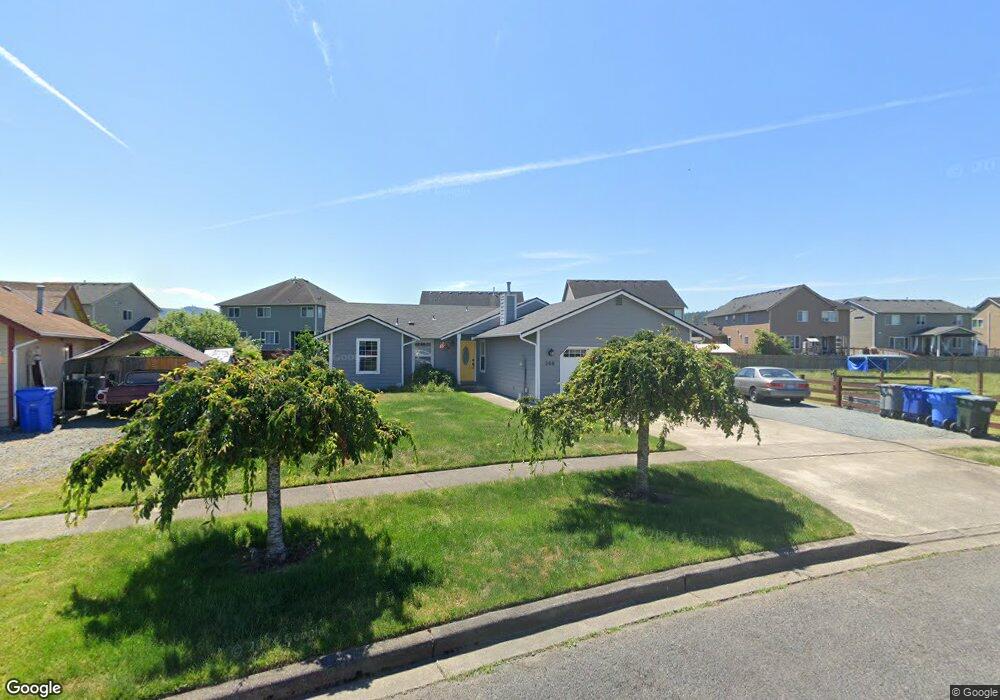
208 Mcmahon Ln SW Orting, WA 98360
Estimated Value: $468,000 - $498,416
3
Beds
2
Baths
1,308
Sq Ft
$371/Sq Ft
Est. Value
About This Home
This home is located at 208 Mcmahon Ln SW, Orting, WA 98360 and is currently estimated at $484,854, approximately $370 per square foot. 208 Mcmahon Ln SW is a home located in Pierce County with nearby schools including Orting Elementary School, Ptarmigan Ridge Elementary School, and Orting Middle School.
Ownership History
Date
Name
Owned For
Owner Type
Purchase Details
Closed on
Jan 25, 2012
Sold by
Qualstar Credit Union
Bought by
Stenerson Suzanne M
Current Estimated Value
Home Financials for this Owner
Home Financials are based on the most recent Mortgage that was taken out on this home.
Original Mortgage
$131,528
Outstanding Balance
$90,024
Interest Rate
3.87%
Mortgage Type
FHA
Estimated Equity
$394,830
Purchase Details
Closed on
Sep 23, 2011
Sold by
Webster Michael and Webster Calle
Bought by
Qualstar Credit Union
Purchase Details
Closed on
Jul 7, 2006
Sold by
Wilson Karen L and Cross Frank L
Bought by
Webster Michael
Home Financials for this Owner
Home Financials are based on the most recent Mortgage that was taken out on this home.
Original Mortgage
$195,600
Interest Rate
6.5%
Mortgage Type
New Conventional
Purchase Details
Closed on
Apr 22, 1994
Sold by
Horizons West Development Inc
Bought by
Duran Eleanor
Create a Home Valuation Report for This Property
The Home Valuation Report is an in-depth analysis detailing your home's value as well as a comparison with similar homes in the area
Home Values in the Area
Average Home Value in this Area
Purchase History
| Date | Buyer | Sale Price | Title Company |
|---|---|---|---|
| Stenerson Suzanne M | $134,950 | First American Title Ins Co | |
| Qualstar Credit Union | $167,000 | None Available | |
| Webster Michael | $244,500 | Ticor | |
| Duran Eleanor | -- | -- |
Source: Public Records
Mortgage History
| Date | Status | Borrower | Loan Amount |
|---|---|---|---|
| Open | Stenerson Suzanne M | $131,528 | |
| Previous Owner | Webster Michael | $195,600 |
Source: Public Records
Tax History
| Year | Tax Paid | Tax Assessment Tax Assessment Total Assessment is a certain percentage of the fair market value that is determined by local assessors to be the total taxable value of land and additions on the property. | Land | Improvement |
|---|---|---|---|---|
| 2025 | $4,193 | $519,000 | $201,000 | $318,000 |
| 2024 | $4,193 | $494,800 | $190,500 | $304,300 |
| 2023 | $4,193 | $458,000 | $182,000 | $276,000 |
| 2022 | $3,922 | $475,200 | $182,000 | $293,200 |
| 2021 | $3,816 | $315,200 | $119,000 | $196,200 |
| 2019 | $3,456 | $283,900 | $101,000 | $182,900 |
| 2018 | $3,550 | $268,200 | $88,000 | $180,200 |
| 2017 | $3,190 | $235,500 | $70,700 | $164,800 |
| 2016 | $2,923 | $189,100 | $58,600 | $130,500 |
| 2014 | $2,422 | $174,500 | $52,400 | $122,100 |
| 2013 | $2,422 | $144,700 | $41,200 | $103,500 |
Source: Public Records
Map
Nearby Homes
- 103 Balmer St SW
- 204 Balmer St SW
- 317 Icey St SW
- 112 Madrona Ln SW
- 103 Harrison Ln SE Unit 1-4
- 836 Harman Way S Unit 73
- 213 Bridge St SW
- 211 Bridge St SW
- 411 Hardefeldt St SE
- 304 Varner Ave SE
- 121 van Scoyoc Ave SW
- 702 Teetor Cir NW Unit LOT 1
- 714 Teetor Cir NW Unit LOT 7
- 704 Teetor NW Unit LOT 2
- 706 Teetor Cir NW Unit LOT 3
- 708 Teetor Cir NW Unit LOT 4
- 710 Teetor Cir NW
- 710 Teetor Cir NW Unit LOT 5
- 716 Teetor Cir NW Unit Lot 08
- 705 Teetor Cir NW Unit Lot 27
- 206 Mcmahon Ln SW
- 105 Balmer St SW
- 101 Balmer St SW
- 204 Mcmahon Ln SW
- 107 Balmer St SW
- 205 Mcmahon Ln SW
- 205 Beckett Ln SW
- 203 Beckett Ln SW
- 201 Balmer St SW
- 203 Mcmahon Ln SW
- 304 Mcmahon Ln SW
- 203 Balmer St SW
- 210 Icey St SW
- 201 Beckett Ln SW
- 201 Mcmahon Ln SW
- 212 Icey St SW
- 102 Balmer St SW
- 205 Balmer St SW
Your Personal Tour Guide
Ask me questions while you tour the home.