208 N 4th St Thornton, IA 50479
Estimated Value: $82,000 - $90,000
3
Beds
1
Bath
1,112
Sq Ft
$77/Sq Ft
Est. Value
About This Home
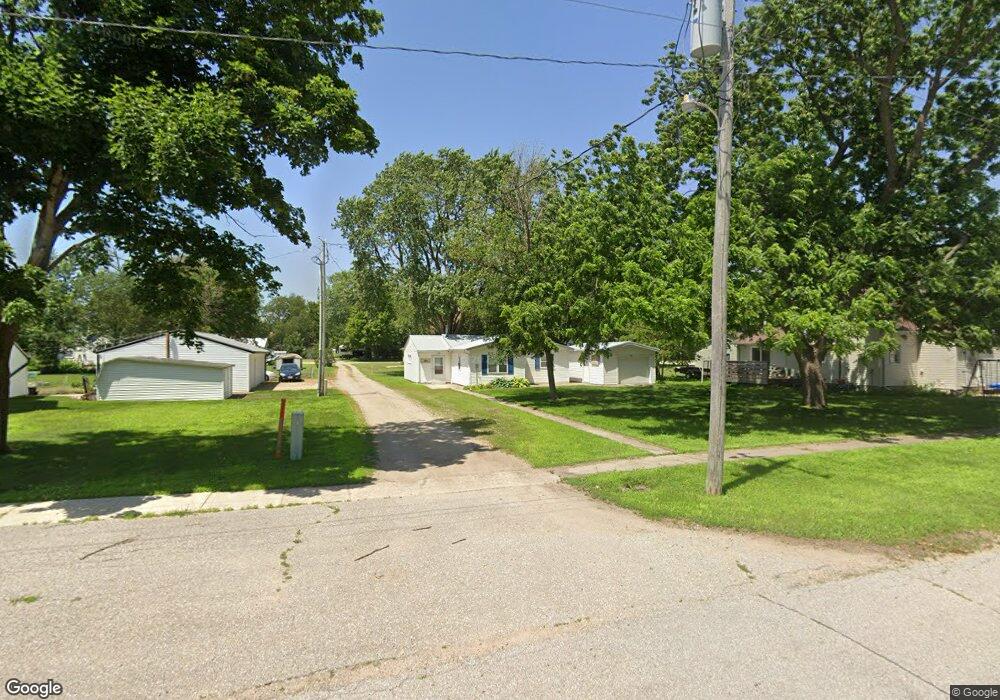
This home is located at 208 N 4th St, Thornton, IA 50479 and is currently estimated at $85,842, approximately $77 per square foot. 208 N 4th St is a home located in Cerro Gordo County with nearby schools including West Fork High School.
Ownership History
Date
Name
Owned For
Owner Type
Purchase Details
Closed on
May 15, 2020
Sold by
Thomas Gerald L and Thomas Patricia A
Bought by
Gustin Jakob E
Current Estimated Value
Home Financials for this Owner
Home Financials are based on the most recent Mortgage that was taken out on this home.
Original Mortgage
$30,525
Outstanding Balance
$26,931
Interest Rate
3.3%
Mortgage Type
FHA
Estimated Equity
$58,911
Purchase Details
Closed on
Aug 10, 2015
Sold by
Netland Marcia K
Bought by
Thomas Gerald L and Thomas Patricia A
Home Financials for this Owner
Home Financials are based on the most recent Mortgage that was taken out on this home.
Original Mortgage
$29,750
Interest Rate
4.03%
Mortgage Type
Future Advance Clause Open End Mortgage
Purchase Details
Closed on
Jun 14, 2007
Sold by
Cole Jeanne L and Jeanne L Cole Revocable Trust
Bought by
Gobeli Donald L
Home Financials for this Owner
Home Financials are based on the most recent Mortgage that was taken out on this home.
Original Mortgage
$28,800
Interest Rate
7.25%
Mortgage Type
Adjustable Rate Mortgage/ARM
Create a Home Valuation Report for This Property
The Home Valuation Report is an in-depth analysis detailing your home's value as well as a comparison with similar homes in the area
Purchase History
| Date | Buyer | Sale Price | Title Company |
|---|---|---|---|
| Gustin Jakob E | $60,000 | None Available | |
| Thomas Gerald L | $35,000 | None Available | |
| Gobeli Donald L | $36,000 | None Availabel |
Source: Public Records
Mortgage History
| Date | Status | Borrower | Loan Amount |
|---|---|---|---|
| Open | Gustin Jakob E | $30,525 | |
| Previous Owner | Thomas Gerald L | $29,750 | |
| Previous Owner | Gobeli Donald L | $28,800 |
Source: Public Records
Tax History
| Year | Tax Paid | Tax Assessment Tax Assessment Total Assessment is a certain percentage of the fair market value that is determined by local assessors to be the total taxable value of land and additions on the property. | Land | Improvement |
|---|---|---|---|---|
| 2025 | $828 | $71,210 | $8,250 | $62,960 |
| 2024 | $828 | $65,040 | $8,250 | $56,790 |
| 2023 | $528 | $65,040 | $8,250 | $56,790 |
| 2022 | $472 | $40,350 | $6,600 | $33,750 |
| 2021 | $440 | $37,240 | $6,600 | $30,640 |
| 2020 | $589 | $34,020 | $6,600 | $27,420 |
| 2019 | $464 | $0 | $0 | $0 |
| 2018 | $436 | $0 | $0 | $0 |
| 2017 | $444 | $0 | $0 | $0 |
| 2016 | $536 | $0 | $0 | $0 |
| 2015 | $536 | $0 | $0 | $0 |
| 2014 | $582 | $0 | $0 | $0 |
| 2013 | $538 | $0 | $0 | $0 |
Source: Public Records
Map
Nearby Homes
Your Personal Tour Guide
Ask me questions while you tour the home.