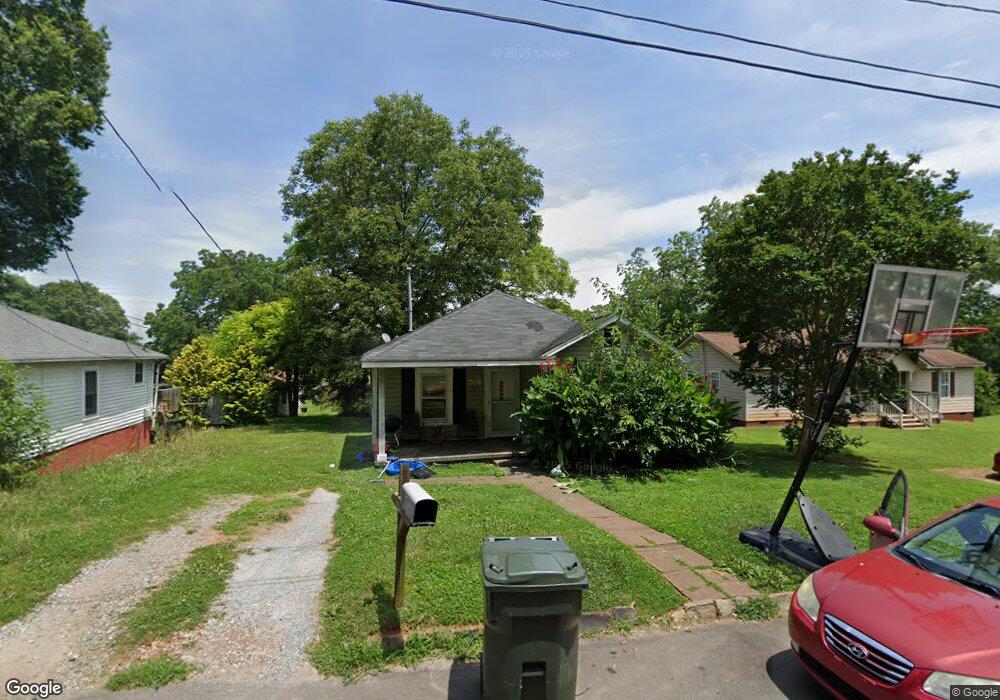
208 N Carpenter St Kings Mountain, NC 28086
Estimated Value: $111,000 - $182,000
--
Bed
--
Bath
880
Sq Ft
$173/Sq Ft
Est. Value
About This Home
This home is located at 208 N Carpenter St, Kings Mountain, NC 28086 and is currently estimated at $152,241, approximately $173 per square foot. 208 N Carpenter St is a home located in Cleveland County with nearby schools including North Elementary School, Kings Mountain Middle, and Kings Mountain Intermediate School.
Ownership History
Date
Name
Owned For
Owner Type
Purchase Details
Closed on
Jul 29, 2021
Sold by
Moore Richard Keith and Moore Gloria Jean
Bought by
Moore Timothy Keith
Current Estimated Value
Purchase Details
Closed on
Sep 14, 2012
Sold by
Federal Home Loan Mortgage Corporation
Bought by
Moore Richard K
Purchase Details
Closed on
May 11, 2012
Sold by
Pullen Aaron
Bought by
Federal Home Loan Mortgage Corporation
Purchase Details
Closed on
Oct 18, 2007
Sold by
Grigg Jeffery S and Grigg Helen Sue
Bought by
Pullen Auron
Home Financials for this Owner
Home Financials are based on the most recent Mortgage that was taken out on this home.
Original Mortgage
$64,000
Interest Rate
6.27%
Mortgage Type
New Conventional
Purchase Details
Closed on
Jun 22, 2007
Sold by
Martha Properties And Investments Llc
Bought by
Grigg Jeffery Scott and Grigg Helen Sue
Purchase Details
Closed on
Mar 30, 2006
Sold by
Martin Christopher Dean and Martin Christina M
Bought by
Martin Properties And Investments Llc
Create a Home Valuation Report for This Property
The Home Valuation Report is an in-depth analysis detailing your home's value as well as a comparison with similar homes in the area
Home Values in the Area
Average Home Value in this Area
Purchase History
| Date | Buyer | Sale Price | Title Company |
|---|---|---|---|
| Moore Timothy Keith | -- | None Available | |
| Moore Richard K | -- | None Available | |
| Federal Home Loan Mortgage Corporation | $15,750 | None Available | |
| Pullen Auron | $64,000 | None Available | |
| Grigg Jeffery Scott | $42,000 | None Available | |
| Martin Properties And Investments Llc | -- | None Available |
Source: Public Records
Mortgage History
| Date | Status | Borrower | Loan Amount |
|---|---|---|---|
| Previous Owner | Pullen Auron | $64,000 |
Source: Public Records
Tax History Compared to Growth
Tax History
| Year | Tax Paid | Tax Assessment Tax Assessment Total Assessment is a certain percentage of the fair market value that is determined by local assessors to be the total taxable value of land and additions on the property. | Land | Improvement |
|---|---|---|---|---|
| 2025 | $902 | $88,017 | $12,487 | $75,530 |
| 2024 | $1,055 | $61,516 | $6,937 | $54,579 |
| 2023 | $1,066 | $61,516 | $6,937 | $54,579 |
| 2022 | $709 | $61,516 | $6,937 | $54,579 |
| 2021 | $712 | $61,516 | $6,937 | $54,579 |
| 2020 | $544 | $45,411 | $4,717 | $40,694 |
| 2019 | $522 | $43,484 | $4,717 | $38,767 |
| 2018 | $521 | $43,484 | $4,717 | $38,767 |
| 2017 | $518 | $43,484 | $4,717 | $38,767 |
| 2016 | $519 | $43,484 | $4,717 | $38,767 |
| 2015 | $583 | $50,392 | $4,717 | $45,675 |
| 2014 | $583 | $50,392 | $4,717 | $45,675 |
Source: Public Records
Map
Nearby Homes
- 308 N Carpenter St
- 110 N Gaston St
- 311 E King St Unit 2
- 5066 Beargrass Dr
- 403 Cherry St
- 405 Clinton Dr
- 506 E Ridge St
- 408 Walnut St
- 409 Chestnut St
- 25 Bennett Dr
- 114 Hendricks St
- 207 Morris St
- 200 E Gold St
- 110 N Oriental Ave
- 116 Walker St
- 109 Fulton St Unit 9
- 309 York Rd
- 106 N Tracy St
- 310 Campbell Cir
- 810 4th St
- 210 N Carpenter St
- 206 N Carpenter St
- 304 E Parker St
- 300 E Parker St
- 306 E Parker St
- 308 E Parker St
- 212 E Parker St
- 203 N Carpenter St
- 301 E Ridge St
- 301A&B Ridge St
- 210 E Parker St
- 213 E Ridge St
- 311 E Ridge St
- 303 E Parker St
- 305 E Parker St
- 301 E Parker St
- 211 E Ridge St
- 307 E Parker St
- 207 N Dilling St
- 213 E Parker St