Estimated Value: $774,000 - $1,100,000
3
Beds
1
Bath
750
Sq Ft
$1,211/Sq Ft
Est. Value
About This Home
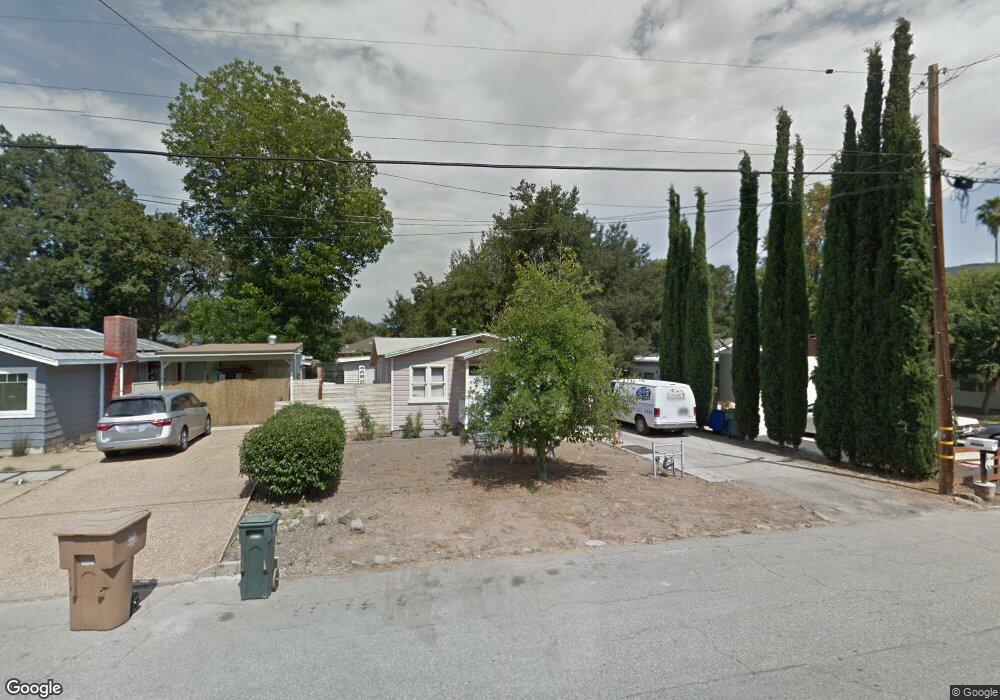
This home is located at 208 N Fulton St, Ojai, CA 93023 and is currently estimated at $908,401, approximately $1,211 per square foot. 208 N Fulton St is a home located in Ventura County with nearby schools including Topa Topa Elementary School, Matilija Junior High, and Legacy High School.
Ownership History
Date
Name
Owned For
Owner Type
Purchase Details
Closed on
Oct 6, 2014
Sold by
Randall Joe D and Randall Joseph Darden
Bought by
Randall Joseph Darden
Current Estimated Value
Purchase Details
Closed on
Nov 17, 2011
Sold by
Randall George H
Bought by
Randall George H
Purchase Details
Closed on
Jan 20, 2004
Sold by
Randall Joe D
Bought by
Randall George H
Create a Home Valuation Report for This Property
The Home Valuation Report is an in-depth analysis detailing your home's value as well as a comparison with similar homes in the area
Home Values in the Area
Average Home Value in this Area
Purchase History
| Date | Buyer | Sale Price | Title Company |
|---|---|---|---|
| Randall Joseph Darden | -- | None Available | |
| Randall Joe D | -- | None Available | |
| Randall George H | -- | None Available | |
| Randall George H | -- | -- | |
| Randall George H | -- | -- | |
| Randall Joe D | -- | -- | |
| Randall Joe D | -- | -- |
Source: Public Records
Tax History Compared to Growth
Tax History
| Year | Tax Paid | Tax Assessment Tax Assessment Total Assessment is a certain percentage of the fair market value that is determined by local assessors to be the total taxable value of land and additions on the property. | Land | Improvement |
|---|---|---|---|---|
| 2025 | $6,826 | $514,854 | $334,659 | $180,195 |
| 2024 | $6,826 | $504,759 | $328,097 | $176,662 |
| 2023 | $6,596 | $494,862 | $321,663 | $173,199 |
| 2022 | $6,511 | $485,159 | $315,356 | $169,803 |
| 2021 | $6,469 | $475,647 | $309,173 | $166,474 |
| 2020 | $6,314 | $470,771 | $306,003 | $164,768 |
| 2019 | $6,136 | $461,541 | $300,003 | $161,538 |
| 2018 | $6,075 | $452,492 | $294,121 | $158,371 |
| 2017 | $5,965 | $443,620 | $288,354 | $155,266 |
| 2016 | $5,501 | $434,922 | $282,700 | $152,222 |
| 2015 | $5,457 | $428,391 | $278,454 | $149,937 |
| 2014 | $927 | $24,911 | $11,958 | $12,953 |
Source: Public Records
Map
Nearby Homes