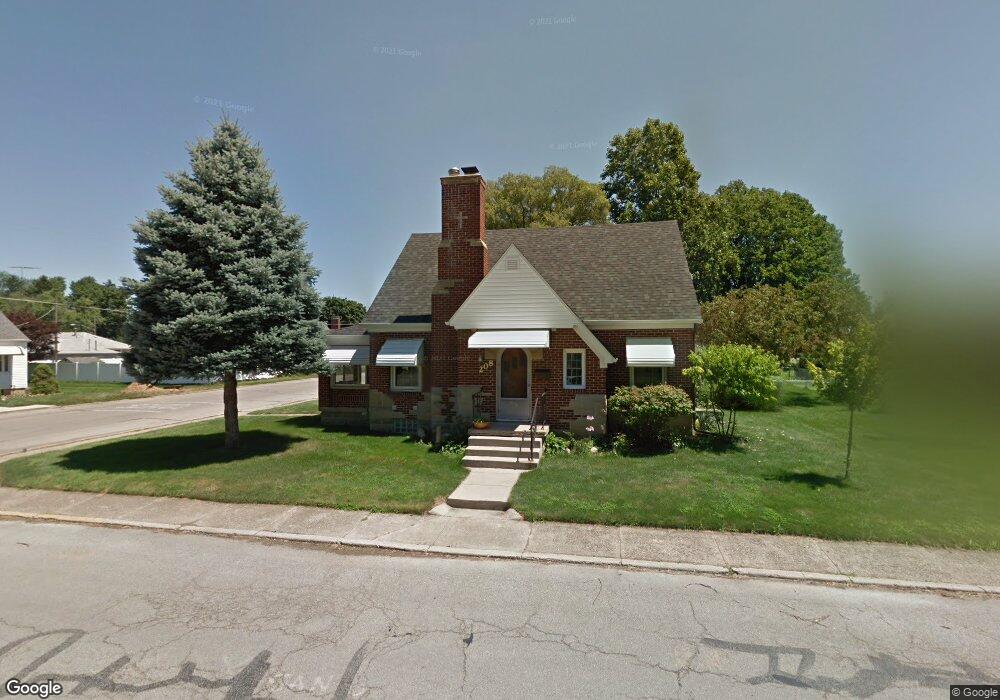
208 N Wenrick St Covington, OH 45318
Estimated Value: $192,000 - $208,000
3
Beds
2
Baths
1,518
Sq Ft
$133/Sq Ft
Est. Value
About This Home
This home is located at 208 N Wenrick St, Covington, OH 45318 and is currently estimated at $202,584, approximately $133 per square foot. 208 N Wenrick St is a home located in Miami County with nearby schools including Covington Elementary/Junior High School, Covington Junior High School, and Covington High School.
Ownership History
Date
Name
Owned For
Owner Type
Purchase Details
Closed on
Feb 6, 2016
Sold by
Frank Richard S and Frank Jeanine S
Bought by
Village Of Covington
Current Estimated Value
Purchase Details
Closed on
Jul 21, 2005
Sold by
Carr Beulah L
Bought by
Frank Richard S and Frank Jeanine S
Home Financials for this Owner
Home Financials are based on the most recent Mortgage that was taken out on this home.
Original Mortgage
$90,000
Interest Rate
5.68%
Mortgage Type
New Conventional
Create a Home Valuation Report for This Property
The Home Valuation Report is an in-depth analysis detailing your home's value as well as a comparison with similar homes in the area
Home Values in the Area
Average Home Value in this Area
Purchase History
| Date | Buyer | Sale Price | Title Company |
|---|---|---|---|
| Village Of Covington | $3,566 | None Available | |
| Frank Richard S | $123,000 | -- |
Source: Public Records
Mortgage History
| Date | Status | Borrower | Loan Amount |
|---|---|---|---|
| Previous Owner | Frank Richard S | $90,000 |
Source: Public Records
Tax History Compared to Growth
Tax History
| Year | Tax Paid | Tax Assessment Tax Assessment Total Assessment is a certain percentage of the fair market value that is determined by local assessors to be the total taxable value of land and additions on the property. | Land | Improvement |
|---|---|---|---|---|
| 2024 | $1,811 | $48,340 | $2,730 | $45,610 |
| 2023 | $1,811 | $48,340 | $2,730 | $45,610 |
| 2022 | $1,806 | $48,340 | $2,730 | $45,610 |
| 2021 | $1,499 | $37,170 | $2,100 | $35,070 |
| 2020 | $1,503 | $37,170 | $2,100 | $35,070 |
| 2019 | $1,509 | $37,170 | $2,100 | $35,070 |
| 2018 | $1,303 | $32,030 | $1,650 | $30,380 |
| 2017 | $1,326 | $32,030 | $1,650 | $30,380 |
| 2016 | $1,309 | $32,030 | $1,650 | $30,380 |
| 2015 | $1,248 | $31,860 | $2,630 | $29,230 |
| 2014 | $1,248 | $31,860 | $2,630 | $29,230 |
| 2013 | $1,202 | $31,860 | $2,630 | $29,230 |
Source: Public Records
Map
Nearby Homes
- 271 N Ludlow St
- 698 E Broadway St
- 00 W Piqua Clay Rd
- 223 Henry Ct
- 124 N Main St
- 133 W Broadway St
- 520 N Pearl St
- 221 S High St
- 501 N Main St Unit C1
- 536 S High St
- 731 N Pearl St
- 210 Charles Ct
- 212 Charles Ct
- 206 Charles Ct
- 208 Charles Ct
- 204 Charles Ct
- 207 Charles Ct
- 205 Charles Ct
- 203 Charles Ct
- 202 Charles Ct
- 591 Chestnut St
- 590 Chestnut St
- 204 N Wenrick St
- 297 N Wenrick St
- 299 N Wenrick St
- 121 N Wenrick St
- 301 N Wenrick St
- 120 N Wenrick St
- 306 N Wenrick St
- 303 N Wenrick St
- 305 Ullery Dr
- 602 Chestnut St
- 119 N Wenrick St
- 294 N Ludlow St
- 298 N Ludlow St
- 304 Ullery Dr
- 305 N Wenrick St
- 290 N Ludlow St
- 114 N Wenrick St
- 308 N Wenrick St