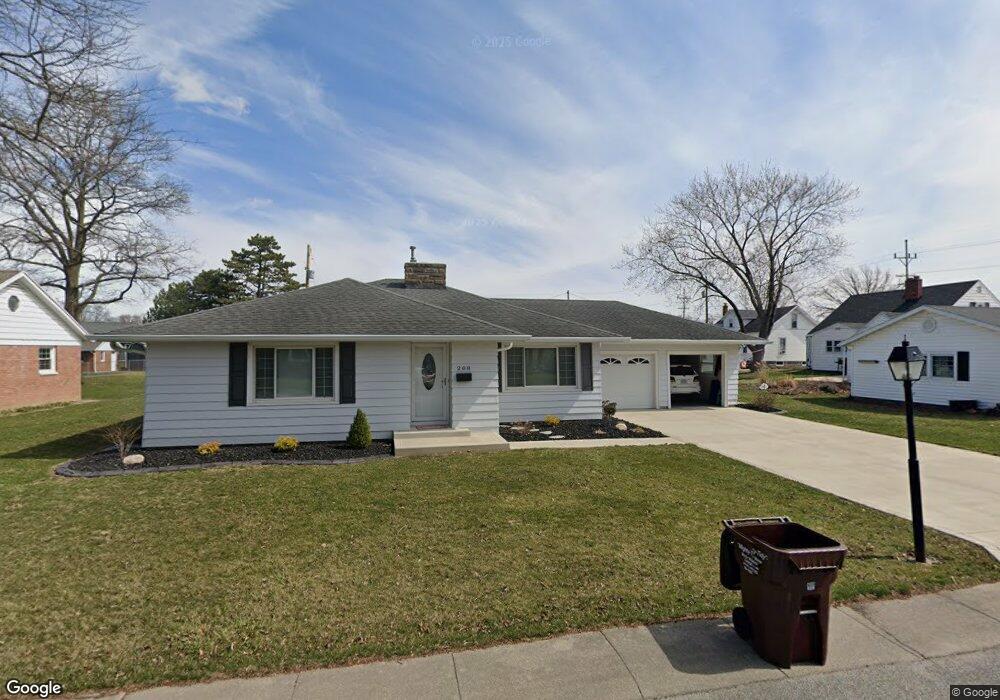
208 Northview Ct Ottawa, OH 45875
Estimated Value: $177,312 - $200,000
3
Beds
2
Baths
1,436
Sq Ft
$133/Sq Ft
Est. Value
About This Home
This home is located at 208 Northview Ct, Ottawa, OH 45875 and is currently estimated at $191,578, approximately $133 per square foot. 208 Northview Ct is a home located in Putnam County with nearby schools including Ottawa-Glandorf High School and Sts. Peter & Paul Catholic School.
Ownership History
Date
Name
Owned For
Owner Type
Purchase Details
Closed on
May 24, 2012
Sold by
Dewar Alice
Bought by
Weaver Karen A and The Karen A Weaver Living Trust
Current Estimated Value
Home Financials for this Owner
Home Financials are based on the most recent Mortgage that was taken out on this home.
Original Mortgage
$92,500
Outstanding Balance
$64,059
Interest Rate
3.89%
Mortgage Type
New Conventional
Estimated Equity
$127,519
Purchase Details
Closed on
Mar 3, 2003
Bought by
Dewar Alice L
Create a Home Valuation Report for This Property
The Home Valuation Report is an in-depth analysis detailing your home's value as well as a comparison with similar homes in the area
Home Values in the Area
Average Home Value in this Area
Purchase History
| Date | Buyer | Sale Price | Title Company |
|---|---|---|---|
| Weaver Karen A | $117,000 | Attorney | |
| Dewar Alice L | $100,000 | -- |
Source: Public Records
Mortgage History
| Date | Status | Borrower | Loan Amount |
|---|---|---|---|
| Open | Weaver Karen A | $92,500 |
Source: Public Records
Tax History Compared to Growth
Tax History
| Year | Tax Paid | Tax Assessment Tax Assessment Total Assessment is a certain percentage of the fair market value that is determined by local assessors to be the total taxable value of land and additions on the property. | Land | Improvement |
|---|---|---|---|---|
| 2024 | $1,435 | $45,520 | $4,390 | $41,130 |
| 2023 | $1,478 | $35,710 | $3,380 | $32,330 |
| 2022 | $1,316 | $35,711 | $3,381 | $32,330 |
| 2021 | $1,322 | $35,710 | $3,380 | $32,330 |
| 2020 | $1,330 | $34,490 | $3,000 | $31,490 |
| 2019 | $1,192 | $31,890 | $3,380 | $28,510 |
| 2018 | $1,172 | $31,890 | $3,380 | $28,510 |
| 2017 | $1,288 | $31,890 | $3,380 | $28,510 |
| 2016 | $1,288 | $34,490 | $3,000 | $31,490 |
| 2015 | $1,297 | $34,490 | $3,000 | $31,490 |
| 2014 | $1,281 | $34,490 | $3,000 | $31,490 |
| 2013 | $1,277 | $34,490 | $3,000 | $31,490 |
Source: Public Records
Map
Nearby Homes
- 443 E 4th St
- 740 E Main St
- 717 E 2nd St
- 530 N Taft Ave
- 1006 E 2nd St
- 370 S Thomas St
- 1417 E 3rd St
- 445 S Oak St
- 717 & 717 1/2 & 721 E Third St
- 304 Oakview (Unit E) Dr
- 0 Sapphire St Unit 225029940
- 1709 S Agner St
- #11 Oakview Dr
- #10 Oakview Dr
- #9 Oakview Dr
- #8 Oakview Dr
- #7 Oakview Dr
- #6 Oakview Dr
- #4 Oakview Dr
- #2 Oakview Dr