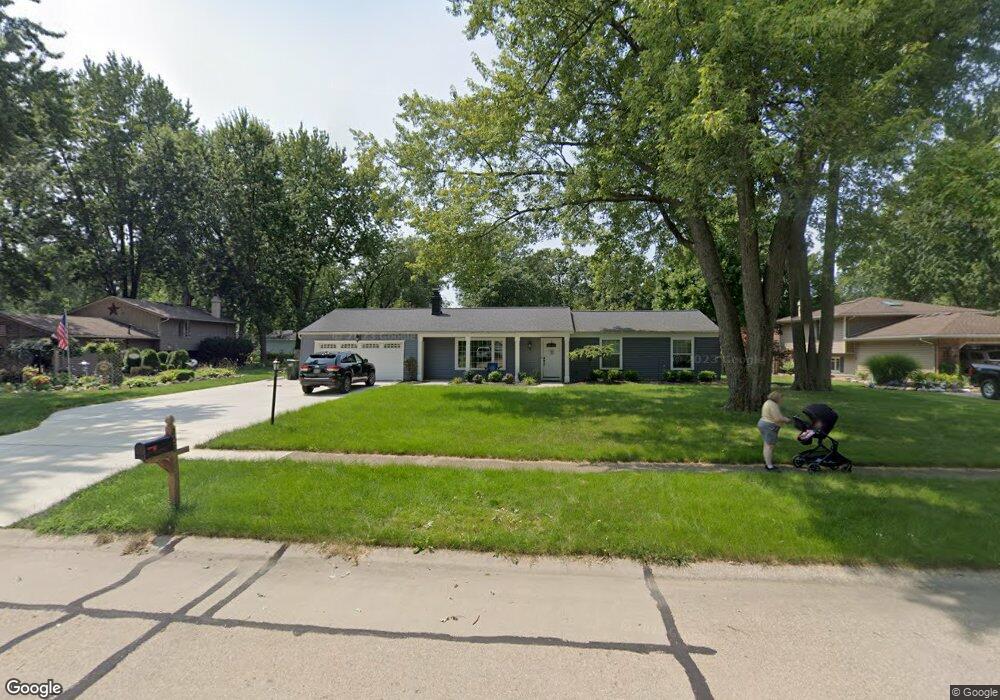
208 Parsons Dr Avon Lake, OH 44012
Estimated Value: $324,000 - $348,000
3
Beds
2
Baths
1,828
Sq Ft
$183/Sq Ft
Est. Value
About This Home
This home is located at 208 Parsons Dr, Avon Lake, OH 44012 and is currently estimated at $334,579, approximately $183 per square foot. 208 Parsons Dr is a home located in Lorain County with nearby schools including Erieview Elementary School, Troy Intermediate Elementary School, and Learwood Middle School.
Ownership History
Date
Name
Owned For
Owner Type
Purchase Details
Closed on
Aug 26, 2025
Sold by
Gibson Joseph R
Bought by
Gibson Julie K
Current Estimated Value
Purchase Details
Closed on
Apr 20, 2011
Sold by
Lpm Real Estate Llc
Bought by
Gibson Joseph R
Home Financials for this Owner
Home Financials are based on the most recent Mortgage that was taken out on this home.
Original Mortgage
$114,800
Interest Rate
4.93%
Mortgage Type
New Conventional
Purchase Details
Closed on
Sep 16, 2010
Sold by
Lawrence Kyle M
Bought by
Lpm Real Estate Llc
Purchase Details
Closed on
Sep 7, 2010
Sold by
Shannon Mary Jo
Bought by
Lawrence Kyle M
Purchase Details
Closed on
Nov 17, 2000
Sold by
Sofranko Kevin A
Bought by
Shannon Gregory A
Home Financials for this Owner
Home Financials are based on the most recent Mortgage that was taken out on this home.
Original Mortgage
$147,150
Interest Rate
11.6%
Create a Home Valuation Report for This Property
The Home Valuation Report is an in-depth analysis detailing your home's value as well as a comparison with similar homes in the area
Home Values in the Area
Average Home Value in this Area
Purchase History
| Date | Buyer | Sale Price | Title Company |
|---|---|---|---|
| Gibson Julie K | $120,000 | None Listed On Document | |
| Gibson Joseph R | $143,500 | Attorney | |
| Lpm Real Estate Llc | -- | Attorney | |
| Lawrence Kyle M | $101,000 | Attorney | |
| Shannon Gregory A | $163,500 | Insignia Title |
Source: Public Records
Mortgage History
| Date | Status | Borrower | Loan Amount |
|---|---|---|---|
| Previous Owner | Gibson Joseph R | $114,800 | |
| Previous Owner | Shannon Gregory A | $147,150 |
Source: Public Records
Tax History Compared to Growth
Tax History
| Year | Tax Paid | Tax Assessment Tax Assessment Total Assessment is a certain percentage of the fair market value that is determined by local assessors to be the total taxable value of land and additions on the property. | Land | Improvement |
|---|---|---|---|---|
| 2024 | $4,044 | $85,477 | $29,484 | $55,993 |
| 2023 | $3,989 | $74,991 | $19,478 | $55,514 |
| 2022 | $3,947 | $74,991 | $19,478 | $55,514 |
| 2021 | $3,938 | $74,991 | $19,478 | $55,514 |
| 2020 | $3,725 | $65,720 | $17,070 | $48,650 |
| 2019 | $3,706 | $65,720 | $17,070 | $48,650 |
| 2018 | $3,615 | $63,900 | $17,070 | $46,830 |
| 2017 | $3,332 | $54,240 | $16,200 | $38,040 |
| 2016 | $3,315 | $54,240 | $16,200 | $38,040 |
| 2015 | $3,331 | $54,240 | $16,200 | $38,040 |
| 2014 | $3,052 | $47,340 | $14,140 | $33,200 |
| 2013 | $3,075 | $47,340 | $14,140 | $33,200 |
Source: Public Records
Map
Nearby Homes
- 217 Sunset Rd
- 205 Sunset Rd
- 252 Yoder Blvd
- 250 Vineyard Rd
- 32363 Lake Rd
- S/L 2 Redwood Blvd
- 32282 Dakota Run
- 137 Armour Rd
- 124 Norman Ave
- 128 Forest Hill Dr
- 110 Oakwood Dr
- 32150 Ventanas Cir
- 191 Norman Ave
- 235 S Point Dr
- 31918 Lake Rd
- 239 S Point Dr
- 31910 Lake Rd
- 161 Tomahawk Dr
- 370 Lear Rd
- 32540 Captains Galley