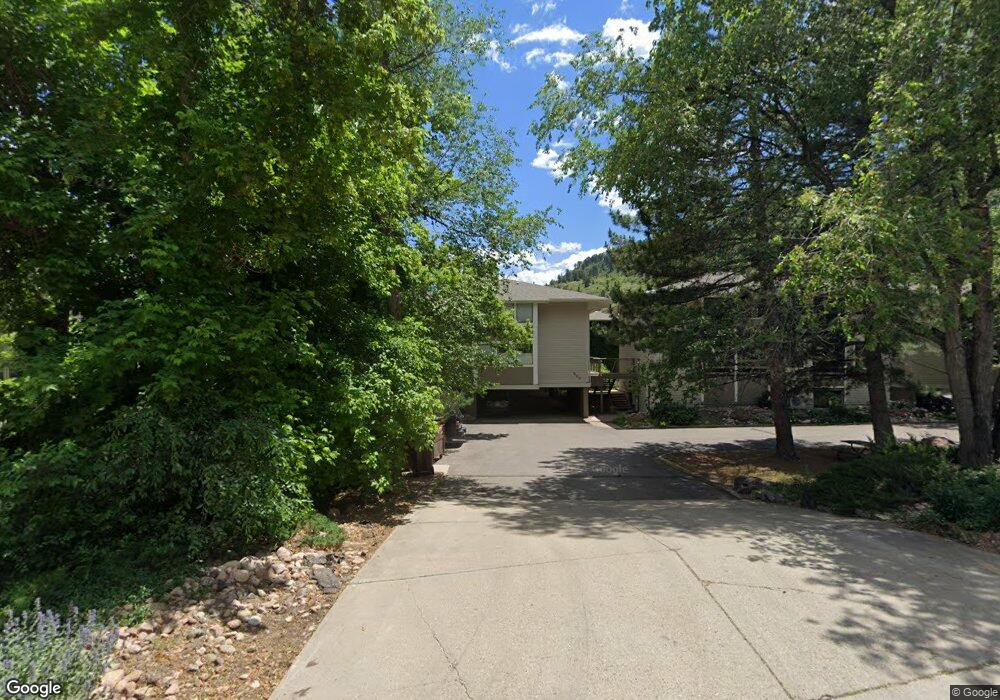
208 Pearl St Unit J Boulder, CO 80302
West Pearl NeighborhoodEstimated Value: $662,000 - $886,000
2
Beds
2
Baths
1,102
Sq Ft
$663/Sq Ft
Est. Value
About This Home
This home is located at 208 Pearl St Unit J, Boulder, CO 80302 and is currently estimated at $730,671, approximately $663 per square foot. 208 Pearl St Unit J is a home located in Boulder County with nearby schools including Whittier Elementary School, Casey Middle School, and Boulder High School.
Ownership History
Date
Name
Owned For
Owner Type
Purchase Details
Closed on
Feb 22, 2017
Sold by
Bianchi John R and Noto Bianchi Marguerite E
Bought by
The Biaanchi 2006 Trust
Current Estimated Value
Purchase Details
Closed on
May 14, 2001
Sold by
Glauser Lori J
Bought by
Bianchi John R and Noto Bianchi Marguerite E
Home Financials for this Owner
Home Financials are based on the most recent Mortgage that was taken out on this home.
Original Mortgage
$231,900
Interest Rate
6.99%
Purchase Details
Closed on
Sep 29, 1997
Sold by
Colburn Catherine J
Bought by
Glauser Lori J
Home Financials for this Owner
Home Financials are based on the most recent Mortgage that was taken out on this home.
Original Mortgage
$117,600
Interest Rate
7.49%
Purchase Details
Closed on
Aug 30, 1993
Bought by
Bianchi John R and Noto Bianc Marguerite E
Purchase Details
Closed on
Jan 5, 1989
Bought by
Bianchi John R and Noto Bianc Marguerite E
Create a Home Valuation Report for This Property
The Home Valuation Report is an in-depth analysis detailing your home's value as well as a comparison with similar homes in the area
Home Values in the Area
Average Home Value in this Area
Purchase History
| Date | Buyer | Sale Price | Title Company |
|---|---|---|---|
| The Biaanchi 2006 Trust | -- | None Available | |
| Bianchi John R | $289,900 | -- | |
| Glauser Lori J | $147,000 | -- | |
| Bianchi John R | $115,200 | -- | |
| Bianchi John R | $65,700 | -- |
Source: Public Records
Mortgage History
| Date | Status | Borrower | Loan Amount |
|---|---|---|---|
| Previous Owner | Bianchi John R | $231,900 | |
| Previous Owner | Glauser Lori J | $117,600 |
Source: Public Records
Tax History
| Year | Tax Paid | Tax Assessment Tax Assessment Total Assessment is a certain percentage of the fair market value that is determined by local assessors to be the total taxable value of land and additions on the property. | Land | Improvement |
|---|---|---|---|---|
| 2025 | $3,984 | $40,119 | -- | $40,119 |
| 2024 | $3,984 | $40,119 | -- | $40,119 |
| 2023 | $3,912 | $44,430 | -- | $48,115 |
| 2022 | $4,248 | $44,939 | $0 | $44,939 |
| 2021 | $4,054 | $46,232 | $0 | $46,232 |
| 2020 | $3,903 | $44,838 | $0 | $44,838 |
| 2019 | $3,843 | $44,838 | $0 | $44,838 |
| 2018 | $3,336 | $38,477 | $0 | $38,477 |
| 2017 | $3,232 | $42,538 | $0 | $42,538 |
| 2016 | $2,259 | $26,093 | $0 | $26,093 |
| 2015 | $2,139 | $22,973 | $0 | $22,973 |
| 2014 | $1,975 | $22,973 | $0 | $22,973 |
Source: Public Records
Map
Nearby Homes
- 358 Arapahoe Ave Unit C
- 350 Arapahoe Ave Unit 17
- 1625 4th St
- 1628 4th St
- 545 Pearl St
- 620 Pearl St Unit C
- 733 Pearl St Unit 4
- 5228 Sunshine Canyon Dr
- 3561 Sunshine Canyon Dr
- 2409 5th St
- 780 Walnut St Unit A
- 604 Mapleton Ave
- 545 Mapleton Ave
- 643 Mapleton Ave
- 934 Spruce St
- 2586 3rd St
- 944 Arapahoe Ave Unit A
- 944 Arapahoe Ave Unit B
- 505 Geneva Ave
- 534 Dewey Ave
- 208 Pearl St Unit M
- 208 Pearl St Unit L
- 208 Pearl St Unit K
- 208 Pearl St Unit I
- 208 Pearl St Unit H
- 208 Pearl St Unit G
- 208 Pearl St Unit F
- 208 Pearl St Unit E
- 208 Pearl St Unit D
- 208 Pearl St Unit C
- 208 Pearl St Unit B
- 208 Pearl St Unit A
- 208 Pearl St
- 1959 Beacon Ct
- 1969 Beacon Ct
- 1949 Beacon Ct
- 225 Canyon Blvd
- 1999 Beacon Ct
- 1979 Beacon Ct
- 1939 Beacon Ct
Your Personal Tour Guide
Ask me questions while you tour the home.