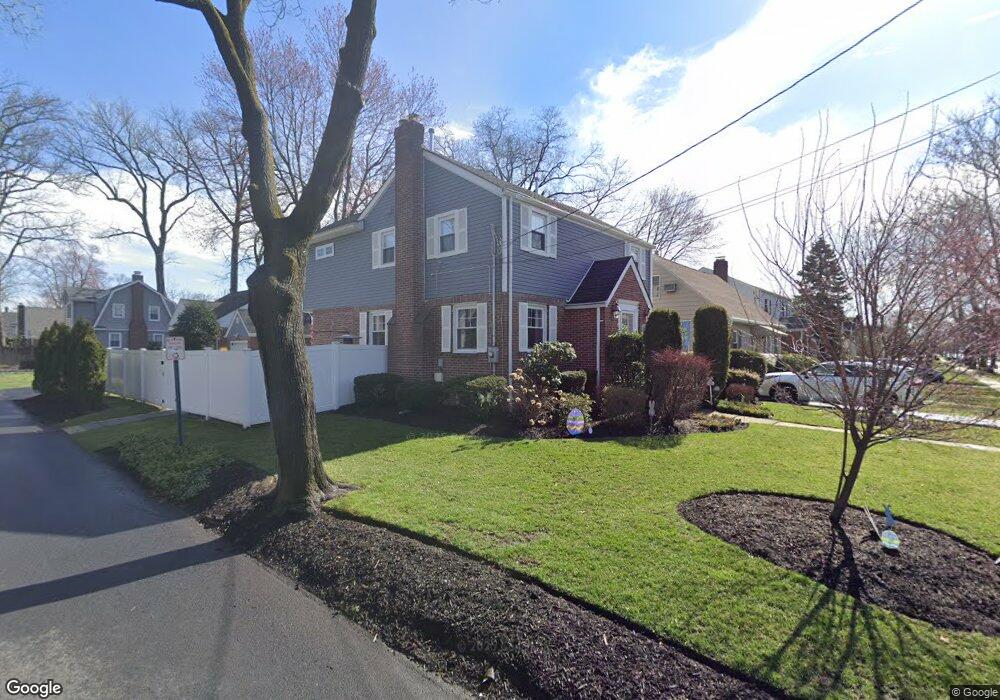
208 Ross Ave Hackensack, NJ 07601
Estimated Value: $602,135 - $699,000
Studio
--
Bath
1,728
Sq Ft
$374/Sq Ft
Est. Value
About This Home
This home is located at 208 Ross Ave, Hackensack, NJ 07601 and is currently estimated at $646,534, approximately $374 per square foot. 208 Ross Ave is a home located in Bergen County with nearby schools including Hackensack High School and Bergen County Christian Academy.
Ownership History
Date
Name
Owned For
Owner Type
Purchase Details
Closed on
Jun 10, 2013
Sold by
Chacon Jason Michael and Cataldi Colleen Elisabeth
Bought by
Chacon Jason Michael and Chaco Colleen Elizabaeth
Current Estimated Value
Home Financials for this Owner
Home Financials are based on the most recent Mortgage that was taken out on this home.
Original Mortgage
$304,000
Outstanding Balance
$215,862
Interest Rate
3.45%
Mortgage Type
New Conventional
Estimated Equity
$430,672
Purchase Details
Closed on
Sep 17, 2009
Sold by
Mannino William and Mannino Ronald
Bought by
Chacon Jason Michael and Cataldi Colleen Elizabeth
Home Financials for this Owner
Home Financials are based on the most recent Mortgage that was taken out on this home.
Original Mortgage
$315,000
Interest Rate
5.12%
Mortgage Type
Purchase Money Mortgage
Create a Home Valuation Report for This Property
The Home Valuation Report is an in-depth analysis detailing your home's value as well as a comparison with similar homes in the area
Home Values in the Area
Average Home Value in this Area
Purchase History
| Date | Buyer | Sale Price | Title Company |
|---|---|---|---|
| Chacon Jason Michael | -- | -- | |
| Chacon Jason Michael | $350,000 | -- |
Source: Public Records
Mortgage History
| Date | Status | Borrower | Loan Amount |
|---|---|---|---|
| Open | Chacon Jason Michael | $304,000 | |
| Previous Owner | Chacon Jason Michael | $315,000 |
Source: Public Records
Tax History
| Year | Tax Paid | Tax Assessment Tax Assessment Total Assessment is a certain percentage of the fair market value that is determined by local assessors to be the total taxable value of land and additions on the property. | Land | Improvement |
|---|---|---|---|---|
| 2025 | $12,096 | $395,800 | $202,500 | $193,300 |
| 2024 | $11,395 | $395,800 | $202,500 | $193,300 |
| 2023 | $10,648 | $395,800 | $202,500 | $193,300 |
| 2022 | $10,648 | $380,000 | $196,000 | $184,000 |
| 2021 | $10,561 | $314,500 | $168,500 | $146,000 |
| 2020 | $10,407 | $314,500 | $168,500 | $146,000 |
| 2019 | $10,397 | $309,700 | $166,000 | $143,700 |
| 2018 | $10,256 | $300,500 | $162,500 | $138,000 |
| 2017 | $9,094 | $266,300 | $160,000 | $106,300 |
| 2016 | $8,624 | $255,300 | $150,000 | $105,300 |
| 2015 | $9,209 | $263,100 | $152,400 | $110,700 |
| 2014 | $8,740 | $263,100 | $152,400 | $110,700 |
Source: Public Records
Map
Nearby Homes
- 258 Ross Ave
- 258 Clinton Place
- 81 Fairmount Ave
- 290 Clinton Place
- 75 Pine St
- 300 Lookout Ave Unit C4
- 150 Grand Ave Unit 1A
- 140 Euclid Ave Unit 6E
- 31 Fairmount Ave Unit 16A
- 31 Fairmount Ave
- 67 Spring Valley Ave
- 290 Anderson St Unit 5D
- 290 Anderson St Unit 2A
- 29 Martin Terrace
- 207 Elm Ave
- 467 Summit Ave
- 120 Louis St
- 32 Martin Terrace
- 245 Anderson St Unit 4G
- 303 Hamilton Place Unit A4
Your Personal Tour Guide
Ask me questions while you tour the home.