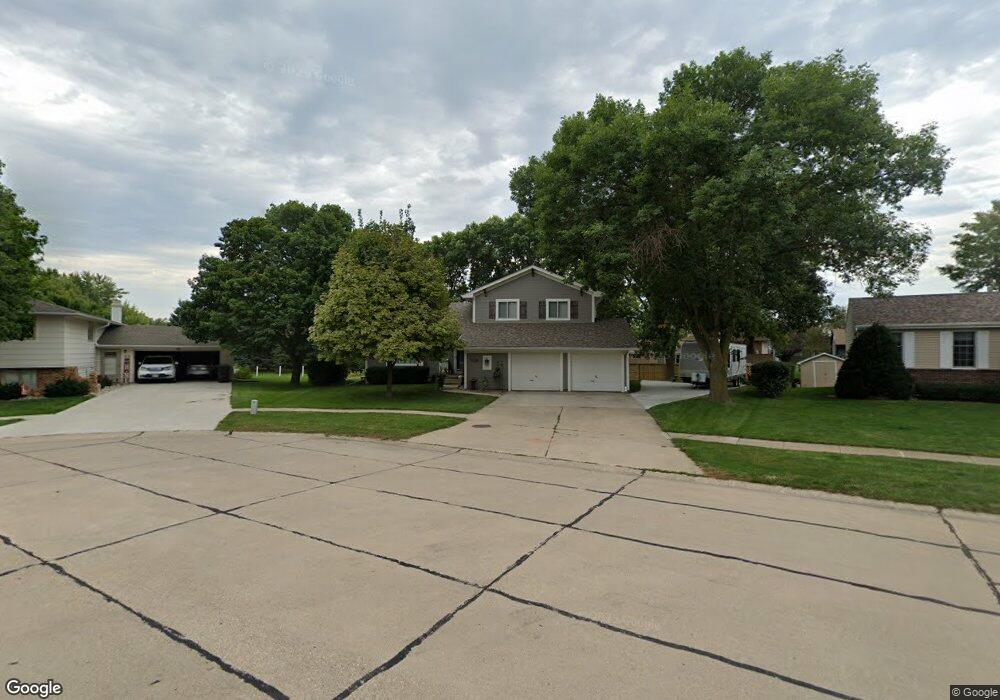
208 Ruby Ct Sergeant Bluff, IA 51054
Estimated Value: $331,000 - $382,000
--
Bed
4
Baths
1,594
Sq Ft
$218/Sq Ft
Est. Value
About This Home
This home is located at 208 Ruby Ct, Sergeant Bluff, IA 51054 and is currently estimated at $348,121, approximately $218 per square foot. 208 Ruby Ct is a home located in Woodbury County with nearby schools including Sergeant Bluff-Luton Primary School, Sergeant Bluff-Luton Elementary School, and Sergeant Bluff-Luton Middle School.
Ownership History
Date
Name
Owned For
Owner Type
Purchase Details
Closed on
Jun 16, 2014
Sold by
Johnson Patricia Ann and Johnson John R
Bought by
Goeden Paul J and Goeden Kendra J
Current Estimated Value
Home Financials for this Owner
Home Financials are based on the most recent Mortgage that was taken out on this home.
Original Mortgage
$185,250
Outstanding Balance
$140,905
Interest Rate
4.2%
Mortgage Type
FHA
Estimated Equity
$207,216
Create a Home Valuation Report for This Property
The Home Valuation Report is an in-depth analysis detailing your home's value as well as a comparison with similar homes in the area
Home Values in the Area
Average Home Value in this Area
Purchase History
| Date | Buyer | Sale Price | Title Company |
|---|---|---|---|
| Goeden Paul J | $195,000 | None Available |
Source: Public Records
Mortgage History
| Date | Status | Borrower | Loan Amount |
|---|---|---|---|
| Open | Goeden Paul J | $185,250 |
Source: Public Records
Tax History
| Year | Tax Paid | Tax Assessment Tax Assessment Total Assessment is a certain percentage of the fair market value that is determined by local assessors to be the total taxable value of land and additions on the property. | Land | Improvement |
|---|---|---|---|---|
| 2025 | $4,308 | $290,930 | $22,940 | $267,990 |
| 2024 | $42 | $289,490 | $24,810 | $264,680 |
| 2023 | $3,992 | $289,490 | $24,810 | $264,680 |
| 2022 | $3,820 | $236,090 | $24,810 | $211,280 |
| 2021 | $3,820 | $228,260 | $24,810 | $203,450 |
| 2020 | $3,420 | $201,410 | $26,550 | $174,860 |
| 2019 | $3,474 | $201,410 | $26,550 | $174,860 |
| 2018 | $3,388 | $201,410 | $26,550 | $174,860 |
| 2017 | $3,388 | $201,410 | $26,550 | $174,860 |
| 2016 | $3,742 | $201,410 | $0 | $0 |
| 2015 | $3,434 | $188,230 | $24,810 | $163,420 |
| 2014 | $3,240 | $171,880 | $24,810 | $147,070 |
Source: Public Records
Map
Nearby Homes