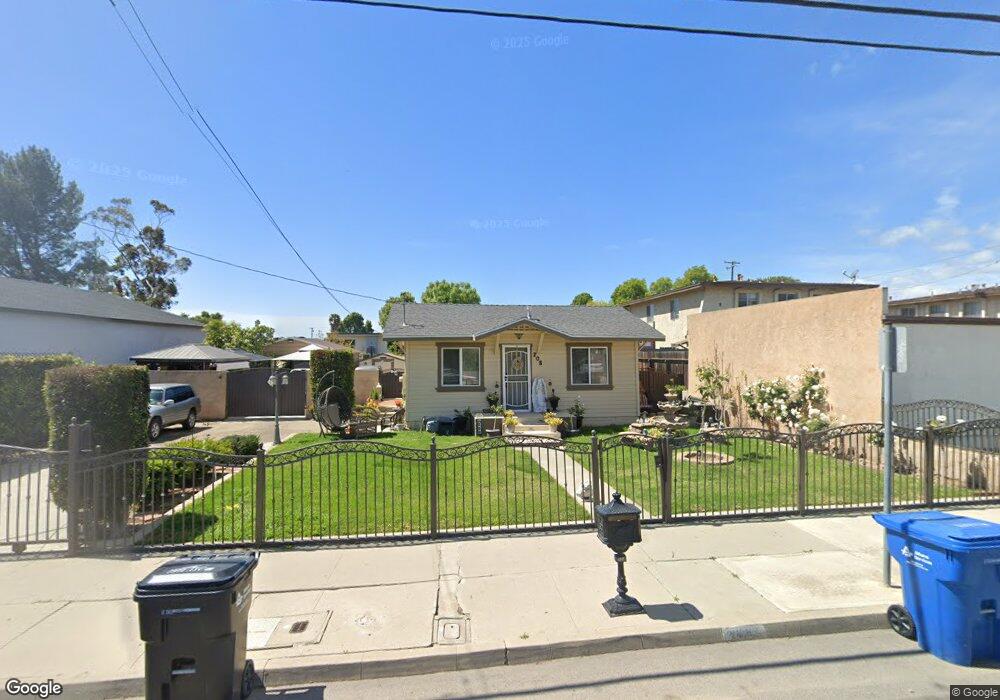
208 S 12th St Santa Paula, CA 93060
Estimated Value: $394,000 - $487,000
1
Bed
1
Bath
482
Sq Ft
$884/Sq Ft
Est. Value
About This Home
This home is located at 208 S 12th St, Santa Paula, CA 93060 and is currently estimated at $425,939, approximately $883 per square foot. 208 S 12th St is a home located in Ventura County with nearby schools including Grace S. Thille Elementary School, Isbell Middle, and Santa Paula High.
Ownership History
Date
Name
Owned For
Owner Type
Purchase Details
Closed on
Aug 14, 2012
Sold by
First Universal Limited Liability Compan
Bought by
Guerrero Luis A and Guerrero Norma L
Current Estimated Value
Home Financials for this Owner
Home Financials are based on the most recent Mortgage that was taken out on this home.
Original Mortgage
$157,003
Outstanding Balance
$109,172
Interest Rate
3.75%
Mortgage Type
FHA
Estimated Equity
$316,767
Purchase Details
Closed on
Apr 19, 2012
Sold by
Mathwin Douglas Lair
Bought by
First Universal Llc
Purchase Details
Closed on
Jun 4, 1997
Sold by
Dominguez Helen M and Small Leticia
Bought by
Mathwin Douglas Lair
Home Financials for this Owner
Home Financials are based on the most recent Mortgage that was taken out on this home.
Original Mortgage
$54,000
Interest Rate
7.93%
Create a Home Valuation Report for This Property
The Home Valuation Report is an in-depth analysis detailing your home's value as well as a comparison with similar homes in the area
Home Values in the Area
Average Home Value in this Area
Purchase History
| Date | Buyer | Sale Price | Title Company |
|---|---|---|---|
| Guerrero Luis A | $160,000 | Chicago Title Company | |
| First Universal Llc | $135,000 | Chicago Title Company | |
| Mathwin Douglas Lair | $53,500 | Old Republic Title Company |
Source: Public Records
Mortgage History
| Date | Status | Borrower | Loan Amount |
|---|---|---|---|
| Open | Guerrero Luis A | $157,003 | |
| Previous Owner | Mathwin Douglas Lair | $54,000 |
Source: Public Records
Tax History Compared to Growth
Tax History
| Year | Tax Paid | Tax Assessment Tax Assessment Total Assessment is a certain percentage of the fair market value that is determined by local assessors to be the total taxable value of land and additions on the property. | Land | Improvement |
|---|---|---|---|---|
| 2025 | $2,222 | $196,892 | $141,608 | $55,284 |
| 2024 | $2,222 | $193,032 | $138,832 | $54,200 |
| 2023 | $2,175 | $189,248 | $136,110 | $53,138 |
| 2022 | $2,111 | $185,538 | $133,441 | $52,097 |
| 2021 | $2,103 | $181,900 | $130,824 | $51,076 |
| 2020 | $2,092 | $180,037 | $129,484 | $50,553 |
| 2019 | $1,979 | $176,508 | $126,946 | $49,562 |
| 2018 | $1,953 | $173,048 | $124,457 | $48,591 |
| 2017 | $1,974 | $169,656 | $122,017 | $47,639 |
| 2016 | $1,856 | $166,330 | $119,625 | $46,705 |
| 2015 | $1,774 | $163,833 | $117,829 | $46,004 |
| 2014 | $1,801 | $160,625 | $115,522 | $45,103 |
Source: Public Records
Map
Nearby Homes
- 120 S Ojai St
- 308 Citrus St
- 317 N Ojai St #Abcde
- 1214 Saticoy St
- 738 E Santa Paula St
- 542 N 13th St
- 963 La Vuelta Place
- 336 E Harvard Blvd
- 1500 Richmond Rd Unit 1
- 1500 Richmond Rd Unit 10
- 1500 Richmond Rd Unit 3
- 344 Campbell Ct
- Lenora Plan at Harvest at Limoneira - Autumnwood
- Lena Plan at Harvest at Limoneira - Autumnwood
- Lennox Plan at Harvest at Limoneira - Autumnwood
- Leigh Plan at Harvest at Limoneira - Autumnwood
- 363 Allen Dr
- 154 E Santa Maria St
- 342 Fuerte Dr
- 107 Sonoma Ln
- 1160 E Ventura St
- 221 S 12th St
- 228 S 12th St
- 1202 E Ventura St
- 227 S 12th St
- 234 S 12th St Unit 1/2
- 234 S 12th St Unit 2
- 242 S 12th St
- 234 234 1/ S 12th St
- 244 S 12th St
- 233 S 12th St
- 1208 E Ventura St
- 246 S 12th St
- 248 S 12th St
- 237 S 12th St
- 250 S 12th St
- 252 S 12th St
- 254 S 12th St
- 256 S 12th St
- 1220 E Ventura St