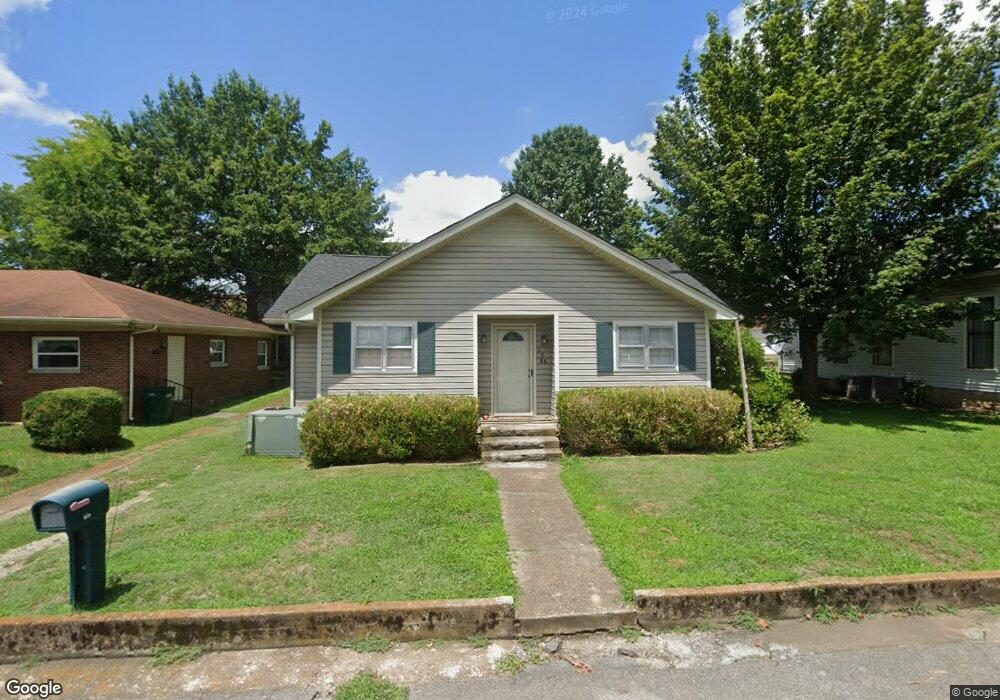
208 S 5th St Pulaski, TN 38478
Estimated Value: $180,255 - $215,000
--
Bed
2
Baths
1,507
Sq Ft
$129/Sq Ft
Est. Value
About This Home
This home is located at 208 S 5th St, Pulaski, TN 38478 and is currently estimated at $195,064, approximately $129 per square foot. 208 S 5th St is a home located in Giles County with nearby schools including Pulaski Elementary School, Southside Elementary School, and Bridgeforth Middle School.
Ownership History
Date
Name
Owned For
Owner Type
Purchase Details
Closed on
Apr 28, 2020
Sold by
Speer Brenda S
Bought by
Speer Brenda S and The Brendaa S Speer Living Tru
Current Estimated Value
Purchase Details
Closed on
May 5, 2009
Sold by
Dunnavant Stephen Jacob
Bought by
Parsons Chancey D
Home Financials for this Owner
Home Financials are based on the most recent Mortgage that was taken out on this home.
Original Mortgage
$61,200
Outstanding Balance
$38,751
Interest Rate
4.89%
Estimated Equity
$156,313
Purchase Details
Closed on
Aug 10, 2007
Sold by
Hamlett Mary Parrish
Bought by
Dunnavant Stephen Jacob
Home Financials for this Owner
Home Financials are based on the most recent Mortgage that was taken out on this home.
Original Mortgage
$56,244
Interest Rate
6.65%
Purchase Details
Closed on
Mar 24, 2000
Sold by
Shelton Robert C
Bought by
Allen Vicki
Purchase Details
Closed on
Mar 21, 1990
Bought by
Shelton Robert C
Purchase Details
Closed on
Aug 13, 1986
Bought by
Massey Robert D and Massey Deborah
Create a Home Valuation Report for This Property
The Home Valuation Report is an in-depth analysis detailing your home's value as well as a comparison with similar homes in the area
Home Values in the Area
Average Home Value in this Area
Purchase History
| Date | Buyer | Sale Price | Title Company |
|---|---|---|---|
| Speer Brenda S | -- | None Available | |
| Parsons Chancey D | $57,000 | -- | |
| Dunnavant Stephen Jacob | $55,120 | -- | |
| Allen Vicki | $54,000 | -- | |
| Shelton Robert C | -- | -- | |
| Massey Robert D | -- | -- |
Source: Public Records
Mortgage History
| Date | Status | Borrower | Loan Amount |
|---|---|---|---|
| Open | Massey Robert D | $61,200 | |
| Previous Owner | Massey Robert D | $56,244 |
Source: Public Records
Tax History Compared to Growth
Tax History
| Year | Tax Paid | Tax Assessment Tax Assessment Total Assessment is a certain percentage of the fair market value that is determined by local assessors to be the total taxable value of land and additions on the property. | Land | Improvement |
|---|---|---|---|---|
| 2024 | $680 | $28,225 | $1,850 | $26,375 |
| 2023 | $680 | $28,225 | $1,850 | $26,375 |
| 2022 | $680 | $28,225 | $1,850 | $26,375 |
| 2021 | $469 | $13,825 | $1,000 | $12,825 |
| 2020 | $469 | $13,825 | $1,000 | $12,825 |
| 2019 | $391 | $13,825 | $1,000 | $12,825 |
| 2018 | $469 | $13,825 | $1,000 | $12,825 |
| 2017 | $469 | $13,825 | $1,000 | $12,825 |
| 2016 | $515 | $14,525 | $1,000 | $13,525 |
| 2015 | $485 | $14,525 | $1,000 | $13,525 |
| 2014 | $485 | $14,527 | $0 | $0 |
Source: Public Records
Map
Nearby Homes
- 210 S 6th St
- 219 W Flower St
- 318 W Jefferson St
- 720 W Madison St
- 321 W Washington St
- 420 Fort Hill Dr
- 602 S 1st St
- 118 S Rhodes St
- 0 Sumpter St
- 123 S Sam Davis Ave
- 124 Chestnut St
- 439 E Madison St
- 418 Jones St
- 140 Phillips St
- 320 Park St
- 303 Magazine Rd
- 326 Ballentine St
- 808 N 1st St
- 403 Victoria St
- 0 N 3rd St