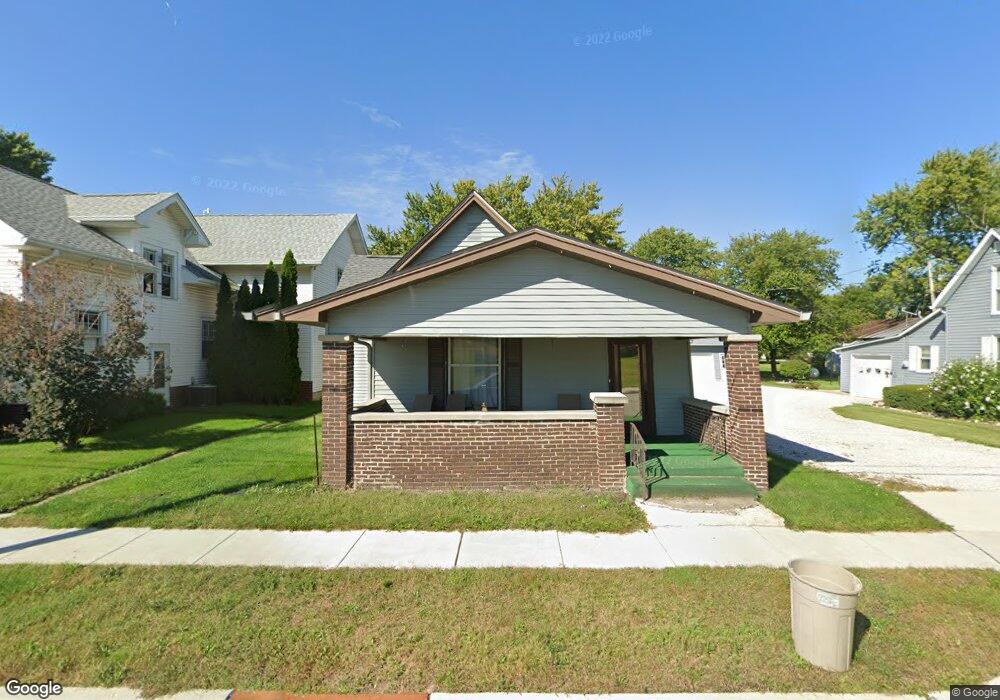
208 S Main St Advance, IN 46102
Estimated Value: $180,000 - $204,000
3
Beds
1
Bath
1,278
Sq Ft
$153/Sq Ft
Est. Value
About This Home
This home is located at 208 S Main St, Advance, IN 46102 and is currently estimated at $195,019, approximately $152 per square foot. 208 S Main St is a home located in Boone County with nearby schools including Western Boone Junior/Senior High School.
Ownership History
Date
Name
Owned For
Owner Type
Purchase Details
Closed on
Jan 31, 2019
Sold by
Hoskins Kevin D and Hoskins Elizabeth D
Bought by
Schneider Christopher
Current Estimated Value
Home Financials for this Owner
Home Financials are based on the most recent Mortgage that was taken out on this home.
Original Mortgage
$116,750
Outstanding Balance
$102,644
Interest Rate
4.5%
Mortgage Type
VA
Estimated Equity
$92,375
Purchase Details
Closed on
Sep 7, 2018
Sold by
Hoskins Lowell Alan
Bought by
Hoskins Kevin D and Hoskins Elizabeth Hoskins
Purchase Details
Closed on
Jul 14, 2010
Sold by
Hoskins Kenneth R and Estate Of Martha L Hoskins
Bought by
Hoskins Kevin D and Hoskins Elizabeth Hoskins
Create a Home Valuation Report for This Property
The Home Valuation Report is an in-depth analysis detailing your home's value as well as a comparison with similar homes in the area
Home Values in the Area
Average Home Value in this Area
Purchase History
| Date | Buyer | Sale Price | Title Company |
|---|---|---|---|
| Schneider Christopher | -- | None Available | |
| Hoskins Kevin D | -- | None Available | |
| Hoskins Kevin D | -- | None Available |
Source: Public Records
Mortgage History
| Date | Status | Borrower | Loan Amount |
|---|---|---|---|
| Open | Schneider Christopher | $116,750 |
Source: Public Records
Tax History Compared to Growth
Tax History
| Year | Tax Paid | Tax Assessment Tax Assessment Total Assessment is a certain percentage of the fair market value that is determined by local assessors to be the total taxable value of land and additions on the property. | Land | Improvement |
|---|---|---|---|---|
| 2024 | $1,364 | $155,800 | $8,300 | $147,500 |
| 2023 | $1,205 | $142,100 | $8,300 | $133,800 |
| 2022 | $1,115 | $124,200 | $8,300 | $115,900 |
| 2021 | $1,023 | $109,600 | $8,300 | $101,300 |
| 2020 | $1,073 | $112,800 | $8,300 | $104,500 |
| 2019 | $855 | $100,200 | $8,300 | $91,900 |
| 2018 | $767 | $93,000 | $8,300 | $84,700 |
| 2017 | $472 | $74,500 | $8,300 | $66,200 |
| 2016 | $1,451 | $72,400 | $9,200 | $63,200 |
| 2014 | $1,358 | $67,800 | $9,200 | $58,600 |
| 2013 | $1,335 | $66,600 | $9,200 | $57,400 |
Source: Public Records
Map
Nearby Homes