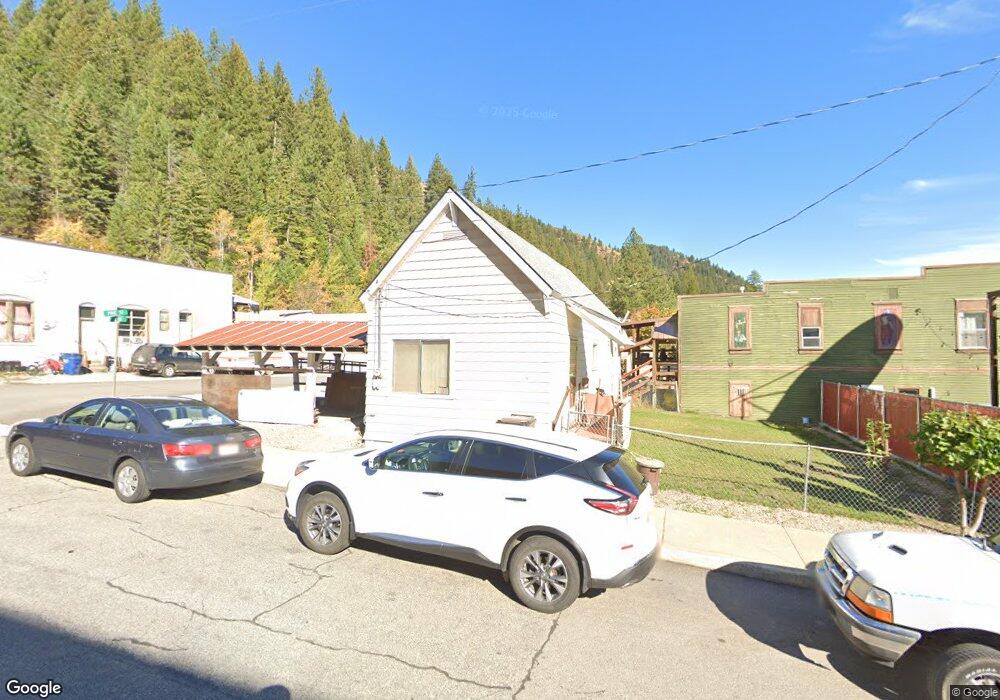
208 Second St Mullan, ID 83846
Estimated Value: $95,000 - $193,000
1
Bed
1
Bath
537
Sq Ft
$259/Sq Ft
Est. Value
About This Home
This home is located at 208 Second St, Mullan, ID 83846 and is currently estimated at $138,828, approximately $258 per square foot. 208 Second St is a home with nearby schools including Mullan School District and John Mullan Elementary School.
Create a Home Valuation Report for This Property
The Home Valuation Report is an in-depth analysis detailing your home's value as well as a comparison with similar homes in the area
Home Values in the Area
Average Home Value in this Area
Tax History
| Year | Tax Paid | Tax Assessment Tax Assessment Total Assessment is a certain percentage of the fair market value that is determined by local assessors to be the total taxable value of land and additions on the property. | Land | Improvement |
|---|---|---|---|---|
| 2025 | $439 | $92,022 | $37,715 | $54,307 |
| 2024 | $503 | $92,022 | $37,715 | $54,307 |
| 2023 | $503 | $90,711 | $41,438 | $49,273 |
| 2022 | $522 | $79,041 | $32,082 | $46,959 |
| 2021 | $524 | $48,388 | $15,358 | $33,030 |
| 2020 | $469 | $41,884 | $13,954 | $27,930 |
| 2019 | $374 | $30,761 | $12,691 | $18,070 |
| 2018 | $377 | $27,949 | $11,538 | $16,411 |
| 2017 | $367 | $26,545 | $11,538 | $15,007 |
| 2016 | $384 | $25,942 | $11,538 | $14,404 |
| 2015 | -- | $25,942 | $11,538 | $14,404 |
| 2014 | -- | $25,942 | $11,538 | $14,404 |
Source: Public Records
Map
Nearby Homes
- 209 Hunter St
- 202 2nd St
- 209 Hunter and 202 Second St
- 219 Hunter St
- 202 Pine St
- 306 N 2nd St Unit 4
- 306 2nd St
- 306 2nd St Unit 4
- 306 2nd St Unit 8
- 306 2nd St Unit 2
- 306 2nd St Unit 3
- 306 2nd St Unit 6 & 7
- 306 2nd St Unit 1
- 306 2nd St Unit 1
- 306 2nd St Unit 5
- 223 Hunter St
- 223 Hunter St
- 115 Hunter St
- 303 Second St
- 209 Pine St
Your Personal Tour Guide
Ask me questions while you tour the home.