3
Beds
2
Baths
2,001
Sq Ft
9,583
Sq Ft Lot
About This Home
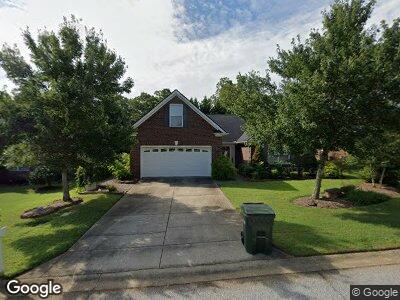
This home is located at 208 St Croix Ct, Greer, SC 29651. 208 St Croix Ct is a home located in Greenville County with nearby schools including Chandler Creek Elementary School, Greer Middle School, and Greer High School.
Ownership History
Date
Name
Owned For
Owner Type
Purchase Details
Closed on
Dec 11, 2023
Sold by
Robertson Brian David and Robertson Neil Joseph
Bought by
Robertson Susan N
Purchase Details
Closed on
Mar 26, 2018
Sold by
Robertson Susan N
Bought by
Robertson Susan N and Robertson Brian David
Purchase Details
Closed on
Oct 23, 2013
Sold by
Robertson Susan N
Bought by
Robertson Thomas James and Robertson Susan N
Purchase Details
Closed on
Dec 28, 2010
Sold by
Garrett James N and Fleming Connie G
Bought by
Robertson Susan N
Purchase Details
Closed on
Nov 16, 2005
Sold by
Garrett Geneva N
Bought by
Garrett Geneva N
Purchase Details
Closed on
Nov 11, 2005
Sold by
Garrett Geneva N
Bought by
Garrett Geneva N
Purchase Details
Closed on
Feb 2, 2005
Sold by
Garrett Geneva N
Bought by
Garrett Geneva N
Purchase Details
Closed on
Jan 27, 2005
Sold by
Garrett Geneva N
Bought by
Garrett Geneva N
Purchase Details
Closed on
Jan 15, 2004
Sold by
Greer Properties Llc
Bought by
Garrett Geneva N
Create a Home Valuation Report for This Property
The Home Valuation Report is an in-depth analysis detailing your home's value as well as a comparison with similar homes in the area
Home Values in the Area
Average Home Value in this Area
Purchase History
| Date | Buyer | Sale Price | Title Company |
|---|---|---|---|
| Robertson Susan N | -- | None Listed On Document | |
| Robertson Susan N | -- | None Available | |
| Robertson Thomas James | -- | -- | |
| Robertson Susan N | $182,500 | -- | |
| Garrett Geneva N | -- | -- | |
| Garrett Geneva N | -- | -- | |
| Garrett Geneva N | -- | -- | |
| Garrett Geneva N | -- | -- | |
| Garrett Geneva N | $160,385 | -- |
Source: Public Records
Tax History Compared to Growth
Tax History
| Year | Tax Paid | Tax Assessment Tax Assessment Total Assessment is a certain percentage of the fair market value that is determined by local assessors to be the total taxable value of land and additions on the property. | Land | Improvement |
|---|---|---|---|---|
| 2024 | $1,609 | $8,090 | $1,200 | $6,890 |
| 2023 | $1,609 | $8,090 | $1,200 | $6,890 |
| 2022 | $1,816 | $8,090 | $1,200 | $6,890 |
| 2021 | $1,786 | $8,090 | $1,200 | $6,890 |
| 2020 | $1,716 | $7,590 | $1,060 | $6,530 |
| 2019 | $1,710 | $7,590 | $1,060 | $6,530 |
| 2018 | $1,376 | $7,590 | $1,060 | $6,530 |
| 2017 | $1,366 | $7,590 | $1,060 | $6,530 |
| 2016 | $1,326 | $189,650 | $26,500 | $163,150 |
| 2015 | $1,286 | $189,650 | $26,500 | $163,150 |
| 2014 | $1,267 | $188,270 | $25,000 | $163,270 |
Source: Public Records
Map
Nearby Homes
- 607 Ashley Commons Ct
- 9 Table Mountain Trail
- 7 Table Mountain Trail
- 747 Laurel Ln
- 106 Aleppo Ln
- 122 Aleppo Ln
- 120 Aleppo Ln
- 109 Ashby Cross Ct
- 104 Ashby Cross Ct
- 204 Summerlea Ln
- 243 Summerlea Ln
- 713 Austin Woods Ct
- 724 Corley Way
- 199 Ccc Camp Rd
- 2 Birch Tree Rd
- 200 Tot Howell Rd
- 204 Tot Howell Rd
- 160 Fox Run Cir
- 27 Henry Clark Ln
- 513 Tehama Place
- 208 St Croix Ct
- 208 Saint Croix Ct
- 210 Saint Croix Ct
- 820 Ansel School Rd
- 204 Saint Croix Ct
- 207 Saint Croix Ct
- 212 Saint Croix Ct
- 211 Saint Croix Ct
- 203 Saint Croix Ct
- 202 Saint Croix Ct
- 213 Saint Croix Ct
- 214 Saint Croix Ct
- 3 Saint Thomas Ct
- 825 Ansel School Rd
- 216 St Croix
- 600 Ashley Commons Ct
- 5 Saint Thomas Ct
- 602 Ashley Commons Ct
- 200 Saint Croix Ct
- 216 Saint Croix Ct