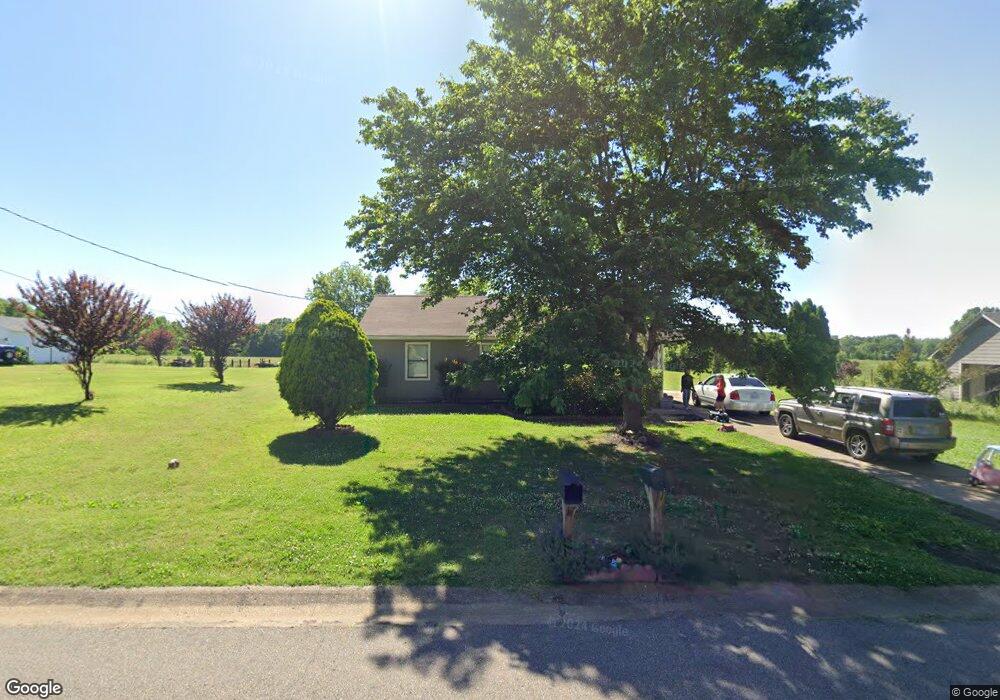
208 Tatlock Cir Covington, TN 38019
Estimated Value: $125,501 - $166,000
Studio
1
Bath
1,067
Sq Ft
$140/Sq Ft
Est. Value
About This Home
This home is located at 208 Tatlock Cir, Covington, TN 38019 and is currently estimated at $148,875, approximately $139 per square foot. 208 Tatlock Cir is a home located in Tipton County with nearby schools including Crestview Elementary School, Crestview Middle School, and Brighton High School.
Ownership History
Date
Name
Owned For
Owner Type
Purchase Details
Closed on
Jun 29, 2007
Bought by
Roland Deanna H
Current Estimated Value
Home Financials for this Owner
Home Financials are based on the most recent Mortgage that was taken out on this home.
Original Mortgage
$52,000
Outstanding Balance
$31,819
Interest Rate
6.37%
Estimated Equity
$117,056
Purchase Details
Closed on
Feb 20, 2007
Sold by
Phillip Jones J
Bought by
Tennessee Housing Development
Purchase Details
Closed on
Sep 29, 1997
Sold by
Hall Jack S
Bought by
Fayne Victor T
Home Financials for this Owner
Home Financials are based on the most recent Mortgage that was taken out on this home.
Original Mortgage
$56,000
Interest Rate
7.6%
Purchase Details
Closed on
Aug 29, 1991
Bought by
Hall Jack S and Hall Jean T
Purchase Details
Closed on
Jul 30, 1987
Bought by
Hall Jack S and Hall Jack S
Create a Home Valuation Report for This Property
The Home Valuation Report is an in-depth analysis detailing your home's value as well as a comparison with similar homes in the area
Purchase History
| Date | Buyer | Sale Price | Title Company |
|---|---|---|---|
| Roland Deanna H | $48,000 | -- | |
| Tennessee Housing Development | -- | -- | |
| Fayne Victor T | $56,000 | -- | |
| Hall Jack S | -- | -- | |
| Hall Jack S | -- | -- |
Source: Public Records
Mortgage History
| Date | Status | Borrower | Loan Amount |
|---|---|---|---|
| Open | Hall Jack S | $52,000 | |
| Previous Owner | Hall Jack S | $56,000 |
Source: Public Records
Tax History
| Year | Tax Paid | Tax Assessment Tax Assessment Total Assessment is a certain percentage of the fair market value that is determined by local assessors to be the total taxable value of land and additions on the property. | Land | Improvement |
|---|---|---|---|---|
| 2025 | $361 | $23,750 | $4,425 | $19,325 |
| 2024 | $361 | $23,750 | $4,425 | $19,325 |
| 2023 | $361 | $23,750 | $4,425 | $19,325 |
| 2022 | $341 | $16,700 | $3,250 | $13,450 |
| 2021 | $380 | $16,700 | $3,250 | $13,450 |
| 2020 | $380 | $18,650 | $3,250 | $15,400 |
| 2019 | $372 | $15,375 | $2,500 | $12,875 |
| 2018 | $372 | $15,375 | $2,500 | $12,875 |
| 2017 | $372 | $15,375 | $2,500 | $12,875 |
| 2016 | $372 | $15,375 | $2,500 | $12,875 |
| 2015 | $372 | $15,375 | $2,500 | $12,875 |
| 2014 | $367 | $15,170 | $0 | $0 |
Source: Public Records
Map
Nearby Homes
- 129 Tatlock Cir
- 597 Walton Loop
- 127 Walton Loop
- 1766 Tennessee 59
- 1321 Tennessee 59
- 145 Quail Rd
- 100 Holly Grove Rd
- 513 Garland Ave
- 635 Oakview Ave
- 503 Terrace Dr
- 1535 Roane St
- 273 Daniel Dr
- 502 James Ave
- 505 Lennanwood Ave
- 316 N High St
- 320 N High St
- 417 Turner Ln
- 902 Hatchie Ave
- 414 Hyde Park Cir
- 900 Peete St
- 194 Tatlock Cir
- 246 Tatlock Cir
- 203 Tatlock Cir
- 243 Tatlock Cir
- 258 Tatlock Cir
- 160 Tatlock Cir
- 299 Tatlock Cir
- 268 Tatlock Cir
- 146 Tatlock Cir
- 129 Tatlock Cir
- 280 Tatlock Cir
- 130 Tatlock Cir
- 327 Tatlock Cir
- 109 Tatlock Cir
- 300 Tatlock Cir
- 110 Tatlock Cir
- 316 Tatlock Cir
- 87 Tatlock Cir
- 355 Tatlock Cir
- 0 Tatlock Cir
Your Personal Tour Guide
Ask me questions while you tour the home.