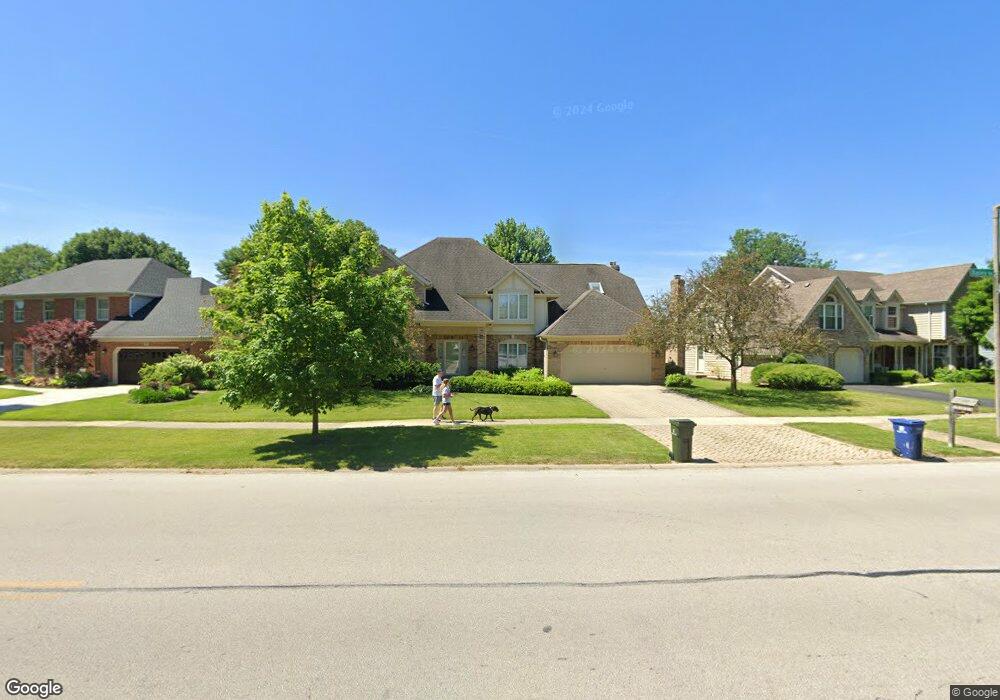
208 W Bailey Rd Unit G Naperville, IL 60565
Winding Creek Estates NeighborhoodEstimated Value: $183,000 - $196,835
2
Beds
2
Baths
980
Sq Ft
$193/Sq Ft
Est. Value
About This Home
This home is located at 208 W Bailey Rd Unit G, Naperville, IL 60565 and is currently estimated at $189,459, approximately $193 per square foot. 208 W Bailey Rd Unit G is a home located in DuPage County with nearby schools including Maplebrook Elementary School, Lincoln Jr. High School, and Naperville Central High School.
Ownership History
Date
Name
Owned For
Owner Type
Purchase Details
Closed on
May 28, 2021
Sold by
Diggs Johnice
Bought by
Asgarali Badruddin
Current Estimated Value
Purchase Details
Closed on
Sep 20, 2001
Sold by
Holmes Janith Laurel
Bought by
Diggs Johnice
Home Financials for this Owner
Home Financials are based on the most recent Mortgage that was taken out on this home.
Original Mortgage
$76,500
Interest Rate
6.97%
Mortgage Type
Purchase Money Mortgage
Purchase Details
Closed on
Jul 19, 1995
Sold by
Helsper Raymond C
Bought by
Holmes Jenith Laurel
Home Financials for this Owner
Home Financials are based on the most recent Mortgage that was taken out on this home.
Original Mortgage
$56,200
Interest Rate
7.51%
Mortgage Type
FHA
Create a Home Valuation Report for This Property
The Home Valuation Report is an in-depth analysis detailing your home's value as well as a comparison with similar homes in the area
Home Values in the Area
Average Home Value in this Area
Purchase History
| Date | Buyer | Sale Price | Title Company |
|---|---|---|---|
| Asgarali Badruddin | $127,000 | Acquest Title Services Llc | |
| Diggs Johnice | $85,500 | -- | |
| Holmes Jenith Laurel | $58,500 | First American Title | |
| Holmes Janith Laurel | $58,500 | First American Title |
Source: Public Records
Mortgage History
| Date | Status | Borrower | Loan Amount |
|---|---|---|---|
| Previous Owner | Diggs Johnice | $76,500 | |
| Previous Owner | Holmes Janith Laurel | $56,200 |
Source: Public Records
Tax History Compared to Growth
Tax History
| Year | Tax Paid | Tax Assessment Tax Assessment Total Assessment is a certain percentage of the fair market value that is determined by local assessors to be the total taxable value of land and additions on the property. | Land | Improvement |
|---|---|---|---|---|
| 2024 | -- | $47,696 | $4,854 | $42,842 |
| 2023 | $2,309 | $43,530 | $4,430 | $39,100 |
| 2022 | $1,830 | $34,280 | $3,490 | $30,790 |
| 2021 | $1,752 | $32,990 | $3,360 | $29,630 |
| 2020 | $1,709 | $32,400 | $3,300 | $29,100 |
| 2019 | $1,646 | $31,000 | $3,160 | $27,840 |
| 2018 | $1,467 | $28,280 | $2,880 | $25,400 |
| 2017 | $1,426 | $27,320 | $2,780 | $24,540 |
| 2016 | $1,385 | $26,330 | $2,680 | $23,650 |
| 2015 | $1,354 | $24,790 | $2,520 | $22,270 |
| 2014 | $1,436 | $25,290 | $2,570 | $22,720 |
| 2013 | $1,667 | $28,800 | $2,930 | $25,870 |
Source: Public Records
Map
Nearby Homes
- 213 Winding Creek Dr
- 1443 Meander Dr
- 344 Waxwing Ave
- 1408 Swallow St
- 303 Cedarbrook Rd
- 165 Tamarack Ave
- 1751 S Washington St Unit 1
- 1921 Wisteria Ct Unit 3
- 128 E Bailey Rd Unit G
- 138 E Bailey Rd Unit M
- 158 E Bailey Rd Unit F
- 425 W Gartner Rd
- 1967 Bristol Ct
- 8S452 Bell Dr
- 2167 Countryside Cir
- 1449 Whitespire Ct Unit 5104
- 47 Glencoe Ct Unit 102D
- 302 Carriage Hill Rd
- 225 Elmwood Dr
- 2132 Berkley Ct Unit 201A
- 208 W Bailey Rd
- 210 W Bailey Rd
- 206 W Bailey Rd
- 212 W Bailey Rd Unit 2
- 204 W Bailey Rd
- 204 W Bailey Rd Unit C
- 205 W Bailey Rd
- 202 W Bailey Rd
- 214 W Bailey Rd
- 201 W Bailey Rd
- 213 W Bailey Rd
- 1404 Fallcreek Ct
- 217 W Bailey Rd
- 216 W Bailey Rd
- 200 W Bailey Rd Unit G2
- 200 W Bailey Rd
- 1408 Fallcreek Ct
- 1405 Fallcreek Ct
- 208 Winding Creek Dr
- 221 W Bailey Rd