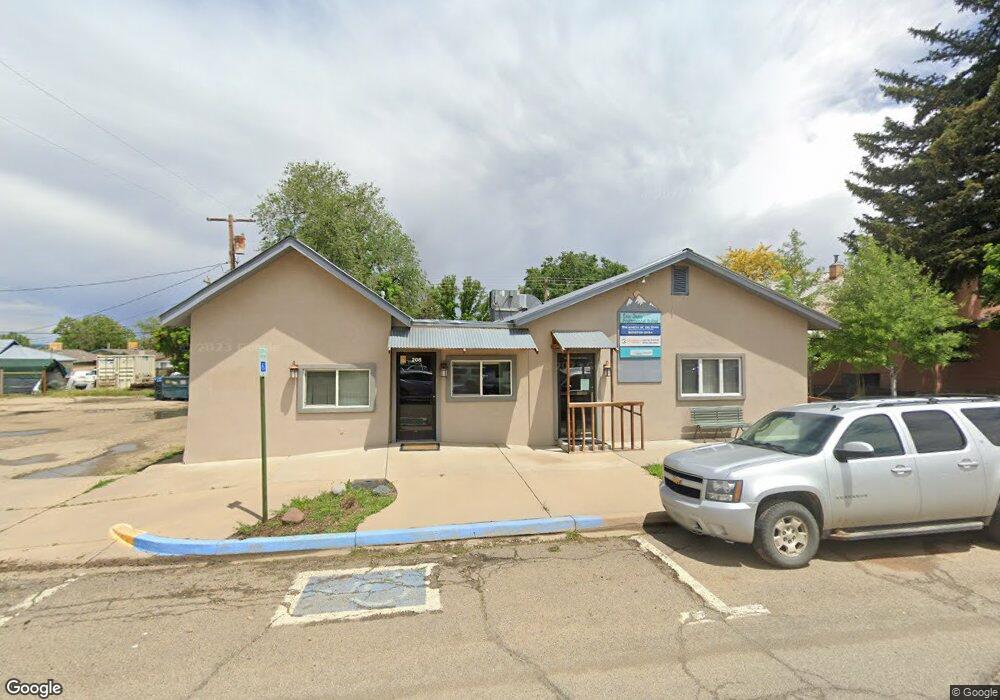
208 W North St Cortez, CO 81321
Estimated Value: $265,618
--
Bed
--
Bath
2,868
Sq Ft
$93/Sq Ft
Est. Value
About This Home
This home is located at 208 W North St, Cortez, CO 81321 and is currently estimated at $265,618, approximately $92 per square foot. 208 W North St is a home located in Montezuma County with nearby schools including Montezuma-Cortez High School, Children's Kiva Montessori School, and Children's Kiva Montessori Preschool & Kindergarten.
Ownership History
Date
Name
Owned For
Owner Type
Purchase Details
Closed on
Nov 6, 2023
Sold by
Carlson Kenneth R and Carlson Louise Anne
Bought by
Southwest Law Llc
Current Estimated Value
Home Financials for this Owner
Home Financials are based on the most recent Mortgage that was taken out on this home.
Original Mortgage
$230,000
Outstanding Balance
$179,479
Interest Rate
6%
Mortgage Type
Seller Take Back
Estimated Equity
$86,139
Purchase Details
Closed on
Mar 19, 2014
Sold by
Southwest Health System Inc
Bought by
Carlson Kenneth R and Carlson Louise Anne
Home Financials for this Owner
Home Financials are based on the most recent Mortgage that was taken out on this home.
Original Mortgage
$92,000
Interest Rate
4.27%
Mortgage Type
Commercial
Purchase Details
Closed on
Jan 26, 1998
Sold by
Sebec Llc
Bought by
Southwest Health System Inc
Purchase Details
Closed on
Jun 15, 1995
Sold by
Merlo Samuel J
Bought by
Wyman Sarah Labrec and Wyman Edwin M
Create a Home Valuation Report for This Property
The Home Valuation Report is an in-depth analysis detailing your home's value as well as a comparison with similar homes in the area
Home Values in the Area
Average Home Value in this Area
Purchase History
| Date | Buyer | Sale Price | Title Company |
|---|---|---|---|
| Southwest Law Llc | $250,000 | None Listed On Document | |
| Carlson Kenneth R | $115,000 | Colorado Land Title Co | |
| Southwest Health System Inc | $234,000 | -- | |
| Wyman Sarah Labrec | $179,000 | -- |
Source: Public Records
Mortgage History
| Date | Status | Borrower | Loan Amount |
|---|---|---|---|
| Open | Southwest Law Llc | $230,000 | |
| Previous Owner | Carlson Kenneth R | $92,000 |
Source: Public Records
Tax History Compared to Growth
Tax History
| Year | Tax Paid | Tax Assessment Tax Assessment Total Assessment is a certain percentage of the fair market value that is determined by local assessors to be the total taxable value of land and additions on the property. | Land | Improvement |
|---|---|---|---|---|
| 2024 | $2,990 | $50,900 | $5,423 | $45,477 |
| 2023 | $2,990 | $59,600 | $5,423 | $54,177 |
| 2022 | $2,906 | $52,467 | $5,423 | $47,044 |
| 2021 | $2,872 | $52,467 | $5,423 | $47,044 |
| 2020 | $3,002 | $56,941 | $5,423 | $51,518 |
| 2019 | $3,009 | $56,941 | $5,423 | $51,518 |
| 2018 | $3,698 | $58,010 | $5,420 | $52,590 |
| 2017 | $3,679 | $58,010 | $5,420 | $52,590 |
| 2016 | $2,926 | $50,940 | $5,420 | $45,520 |
| 2015 | $2,686 | $277,560 | $0 | $0 |
| 2014 | $1,787 | $29,100 | $0 | $0 |
Source: Public Records
Map
Nearby Homes
- 235 N Chestnut St Unit 6
- 240 N Elm St
- 23 E Montezuma Ave
- 115 S Linden St
- 409 N Broadway
- 102 E Montezuma Ave
- 210 W Coronado Ave
- 537 N Elm St
- 122 E 1st St Unit see broker remarks
- Tract 9 N Broadway
- 521 N Beech St
- 420 W 4th St
- 323 N Washington St
- 416 N Ash St
- 201 S Washington St
- 243 N Madison St
- 417 S Oak St
- 306 S Ash St
- 145 S Madison St
- 500 S Market St
- W North St
- 210 W North St
- 121 N Elm St
- 236 W North St
- 122 N Linden St
- 114 N Linden St
- 215 W Montezuma Ave
- 33 N Elm St
- 145 N Elm St
- 211 W Montezuma Ave
- 207 W Montezuma Ave
- 219 W Montezuma Ave
- 18184 Road 21
- 140 N Linden St
- 113 N Linden St
- 123 N Linden St
- 220 W Main St
- W Main St Unit 28
- W Main St
- 200 W Main St