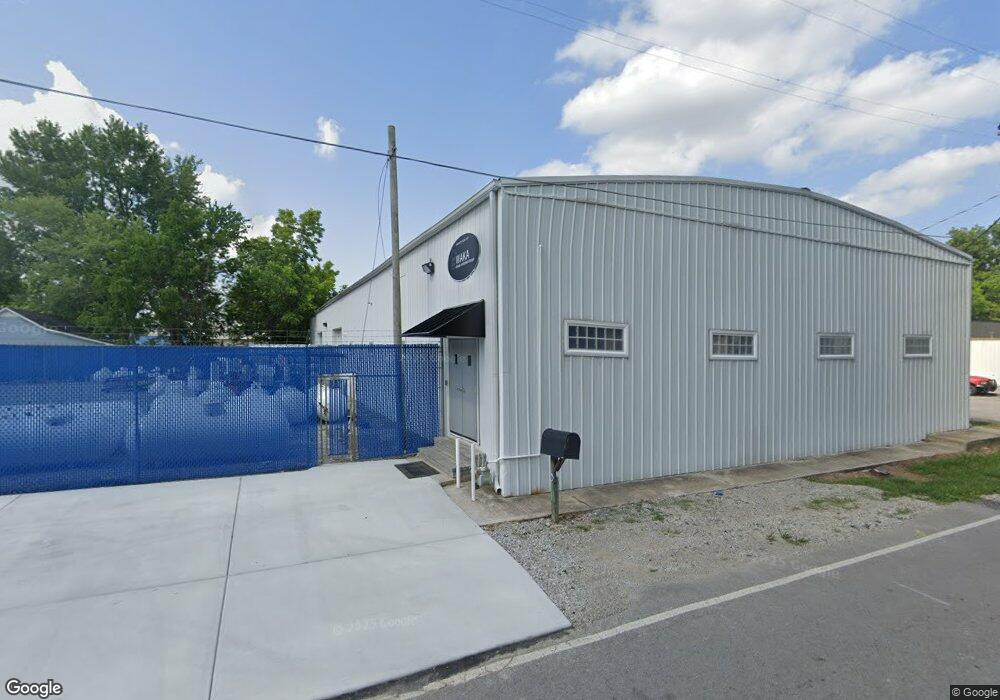
208 W Short St Manchester, TN 37355
Estimated Value: $354,869
--
Bed
3
Baths
6,000
Sq Ft
$59/Sq Ft
Est. Value
About This Home
This home is located at 208 W Short St, Manchester, TN 37355 and is currently estimated at $354,869, approximately $59 per square foot. 208 W Short St is a home located in Coffee County with nearby schools including Westwood Middle School and Temple Baptist Christian School.
Ownership History
Date
Name
Owned For
Owner Type
Purchase Details
Closed on
Oct 8, 2021
Sold by
Jones Mederick L and Jones Tamara J
Bought by
Henley Brett and Mccormick Martha
Current Estimated Value
Purchase Details
Closed on
Aug 13, 2010
Sold by
Clearwater Pool
Bought by
Jones Mederick L
Home Financials for this Owner
Home Financials are based on the most recent Mortgage that was taken out on this home.
Original Mortgage
$187,000
Interest Rate
4.61%
Mortgage Type
Commercial
Purchase Details
Closed on
Jul 25, 2007
Sold by
An-Co Investments
Bought by
Clearwater Pool & Spa Inc
Purchase Details
Closed on
Aug 27, 2003
Sold by
Haddon B J
Bought by
Anderson Steve
Home Financials for this Owner
Home Financials are based on the most recent Mortgage that was taken out on this home.
Original Mortgage
$90,000
Interest Rate
6.13%
Mortgage Type
Commercial
Purchase Details
Closed on
Mar 6, 1995
Bought by
Haddon B J
Create a Home Valuation Report for This Property
The Home Valuation Report is an in-depth analysis detailing your home's value as well as a comparison with similar homes in the area
Home Values in the Area
Average Home Value in this Area
Purchase History
| Date | Buyer | Sale Price | Title Company |
|---|---|---|---|
| Henley Brett | $275,000 | None Available | |
| Jones Mederick L | $195,000 | -- | |
| Clearwater Pool & Spa Inc | $180,000 | -- | |
| Anderson Steve | $90,000 | -- | |
| Haddon B J | $28,900 | -- |
Source: Public Records
Mortgage History
| Date | Status | Borrower | Loan Amount |
|---|---|---|---|
| Previous Owner | Haddon B J | $187,000 | |
| Previous Owner | Haddon B J | $90,000 |
Source: Public Records
Tax History Compared to Growth
Tax History
| Year | Tax Paid | Tax Assessment Tax Assessment Total Assessment is a certain percentage of the fair market value that is determined by local assessors to be the total taxable value of land and additions on the property. | Land | Improvement |
|---|---|---|---|---|
| 2024 | $4,316 | $102,360 | $12,000 | $90,360 |
| 2023 | $4,316 | $102,360 | $0 | $0 |
| 2022 | $3,716 | $102,360 | $12,000 | $90,360 |
| 2021 | $3,348 | $73,120 | $10,000 | $63,120 |
| 2020 | $3,348 | $73,120 | $10,000 | $63,120 |
| 2019 | $3,348 | $73,120 | $10,000 | $63,120 |
| 2018 | $3,348 | $73,120 | $10,000 | $63,120 |
| 2017 | $3,617 | $68,960 | $10,000 | $58,960 |
| 2016 | $3,617 | $68,960 | $10,000 | $58,960 |
| 2015 | $3,617 | $68,960 | $10,000 | $58,960 |
| 2014 | $3,618 | $68,964 | $0 | $0 |
Source: Public Records
Map
Nearby Homes
- 509 Oakdale St
- 204 W Short St
- 505 Oakdale St
- 209 W Short St
- 603 Oakdale St Unit 5
- 603 Oakdale St Unit 2
- 603 Oakdale St Unit 3
- 603 Oakdale St Unit 3&4
- 603 Oakdale St Unit 1-4
- 211 W Short St
- 205 W Short St
- 512 Oakdale St
- 600 Maple St
- 300 W Short St
- 504 Oakdale St
- 602 Maple St
- 502 Oakdale St
- 600 Oakdale St
- 203 W Short St
- 314 W Short St